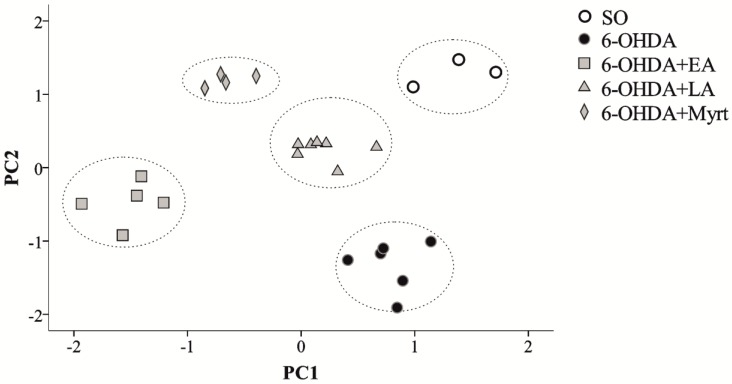
Figure 8.
Representation of the individual rat data points, using the first two principal components (PC1 and PC2) on a two dimensional space, shows that the rats tend to cluster according to their treatments. Hierarchical cluster analysis of the data (dotted ellipses). SO—white circles; PD 6-OHDA—black circles, 6-OHDA + EA—grey squares, 6-OHDA + LA—grey triangles, 6-OHDA + Myrt—grey diamonds.

