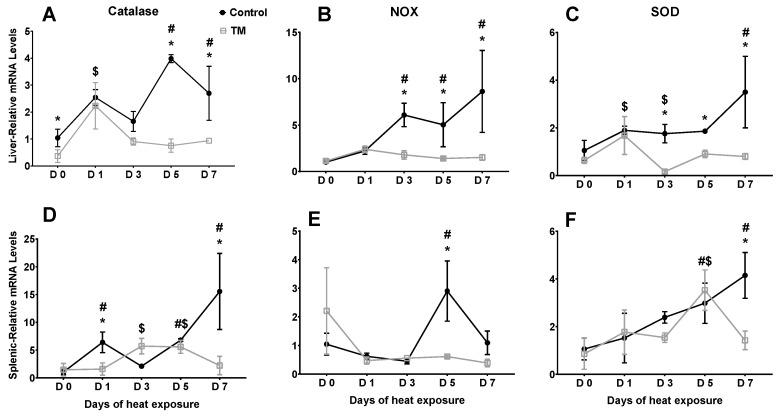
Figure 2.
Effect of post-hatch heat stress for 7 days (PD 28 to 35) on the mRNA levels of catalase, NOX4, and SOD2 in the liver (A–C) and spleen (D–F) of TM broiler chicks (n = 5). * within the same day, means ± SD of TM and control chicks are significantly different. # within the control group, means ± SD of non-identical days differ significantly. $ within the TM group, means ± SD of non-identical days differ significantly.

