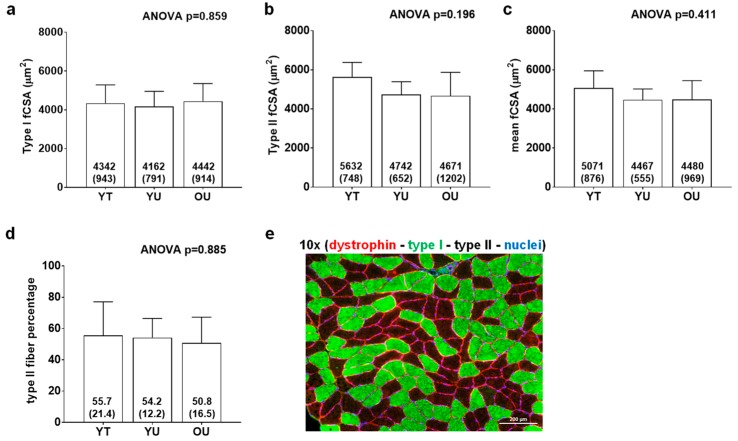
Figure 2.
Histology data between cohorts. Data include type I fiber cross-sectional area (fCSA) (panel a), type II fCSA (panel b), mean (type I + II) fCSA (panel c), and type II fiber percentage (panel d) of younger trained (YT), younger untrained (YU), and older untrained (OU) participants. Numerical values within bars represent mean ± standard deviation values. Panel e contains a representative 10× image of muscle fibers in cross section (scale bar = 200 μm).

