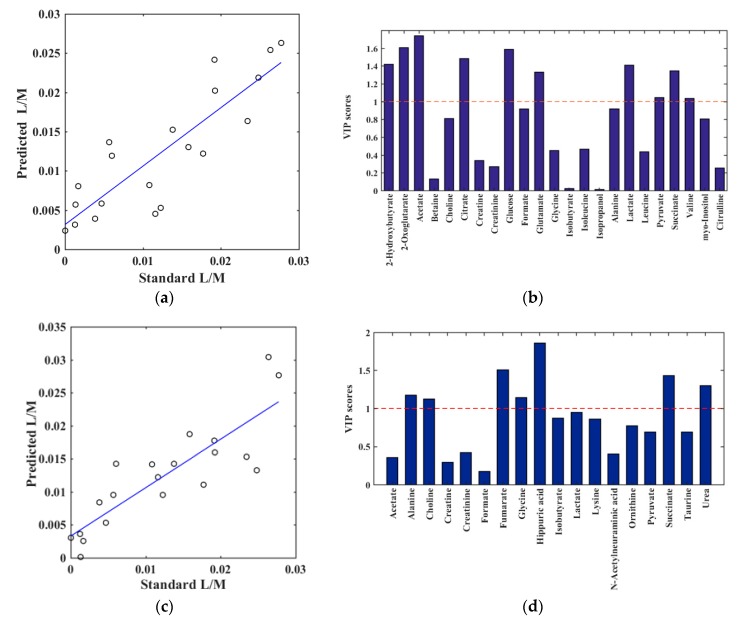
Figure 3.
Results of partial least squares (PLS) regression models between the quantified NMR spectra (X-variables) and L/M ratio by enzymatic assay (y-variable). (a,b): Plasma metabolites and (c,d): Urine metabolites. For the plasma metabolites, the PLS model was obtained by one component, validated by leave-one-out method (R2 = 0.75, Q2 = 0.50 and root mean square error of cross validation (RMSECV) = 6.2 × 10⁻³). (a) plasma predicted versus quantified L/M, (b) plasma corresponding variable importance in projection (VIP) score plot, providing an estimation of the importance of each metabolite in PLS. A variable with a VIP score greater than 1 (dashed line) is considered important. For the urine metabolites, the PLS model was obtained by two components, validated by leave-one-out method (R2 = 0.73, Q2 = 0.51 and RMSECV = 6.2 × 10⁻³). (c) urine predicted versus quantified L/M, (d) urine VIP score plot.

