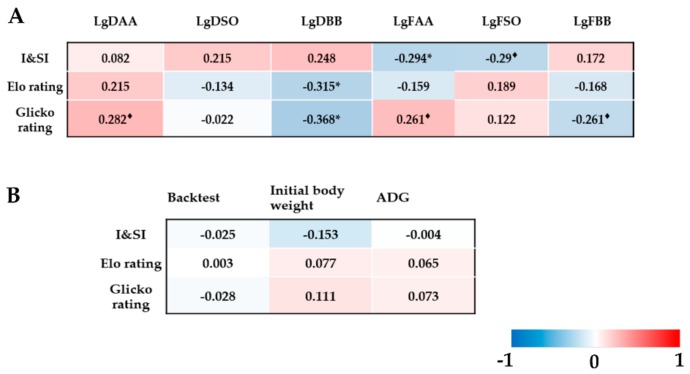
Figure 3.
(A) Partial correlation analyses between hierarchical indices (I&SI, Elo rating, or Glicko rating) and logarithms of dyadic behavioral indicators. (B) Partial correlation analyses between hierarchical indices (I&SI, Elo rating, or Glicko ratings) and backtest score, initial body weight or average daily gain (ADG). “*” represents p < 0.05. “♦” represents 0.05 < p < 0.1. Blue color represents negative correlation and red color represents positive correlation. Cells were colored on a gradient from blue (r = −1) to red (r = 1), where the colors were related to the correlation coefficients. DAA = Duration of active attack; DSO = Duration of standoff; DBB = Duration of being bullied; FAA = Frequency of active attack; FSO = Frequency of standoff; FBB = Frequency of being bullied.

