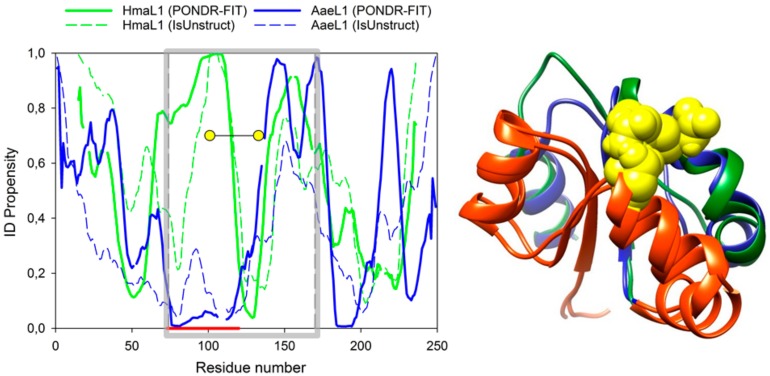
Figure 6.
(Left) Calculation of intrinsic disorder propensities for amino acid sequences in HmaL1 (green) and AaeL1 (blue) proteins performed in PONDR® FIT (solid lines) and IsUnstruct (dashed lines). Gray square limits regions of amino acid sequences forming domain II. Thick red line below the plot shows a region of the highest difference in intrinsic disorder propensities between AaeL1 and HmaL1 proteins. Yellow circles show the positions of inserted disulfide bonds. (Right) Superposition of three-dimensional structure of domains II of HmaL1 (green) and AaeL1 (blue). Regions of the highest difference in IDP part of AaeL1 and HmaL1 is colored red. Yellow spheres highlight amino acid residues selected for substitution to cysteine residues, D101 and K127 in AaeL1 and E82 and D114 in HmaL1.

