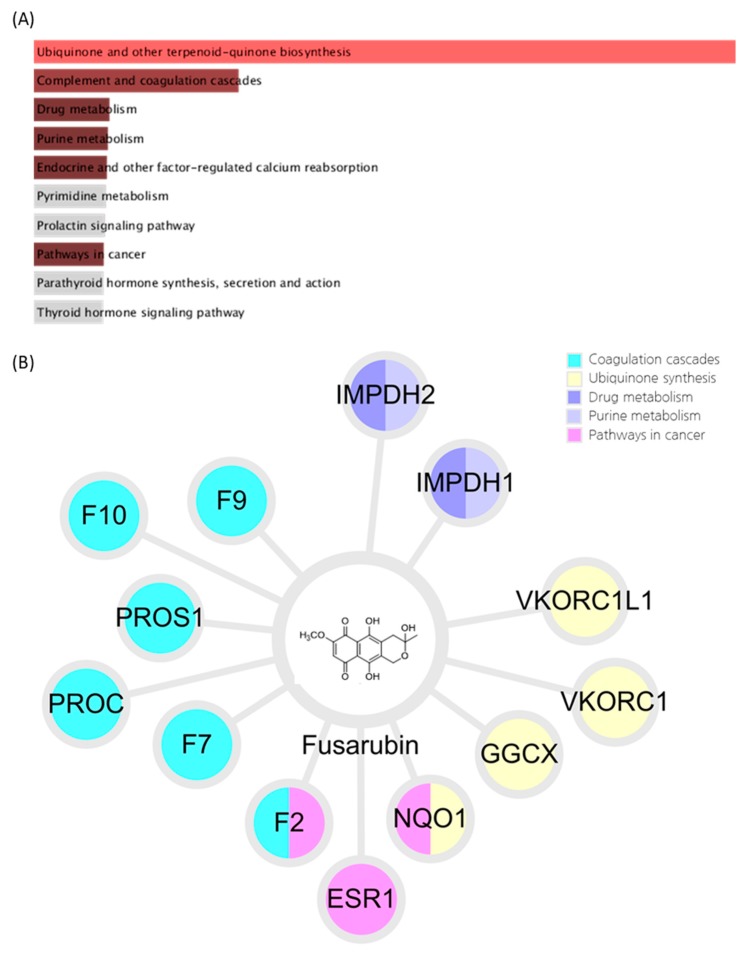
Figure 5.
Results of fusarubin analysis using a systems-pharmacological approach (A) Pathways related to the predicted targets of fusarubin. Bar graphs represent the combined scores of KEGG pathways calculated using gene set enrichment analysis. The red and brown colored bar graphs represent pathways that have a significant p-value. (B) Compound-target network of fusarubin. Colored nodes represent the target genes, and each color indicates related pathway with significant combined score. F9, Coagulation factor IX; F10, Coagulation factor X; PROS1, Vitamin K-dependent protein S; PROC, Vitamin K-dependent protein C; F7, Coagulation factor VII; F2, Prothrombin; ESR1, Estrogen receptor; NQO1, NAD(P)H dehydrogenase 1; GGCX, Vitamin K-dependent gamma-carboxylase; VKORC1, Vitamin K epoxide reductase complex subunit 1; VKORC1L1, Vitamin K epoxide reductase complex subunit 1-like protein 1; IMPDH1, Inosine-5′-monophosphate dehydrogenase 1; IMPDH2, Inosine-5′-monophosphate dehydrogenase 2.

