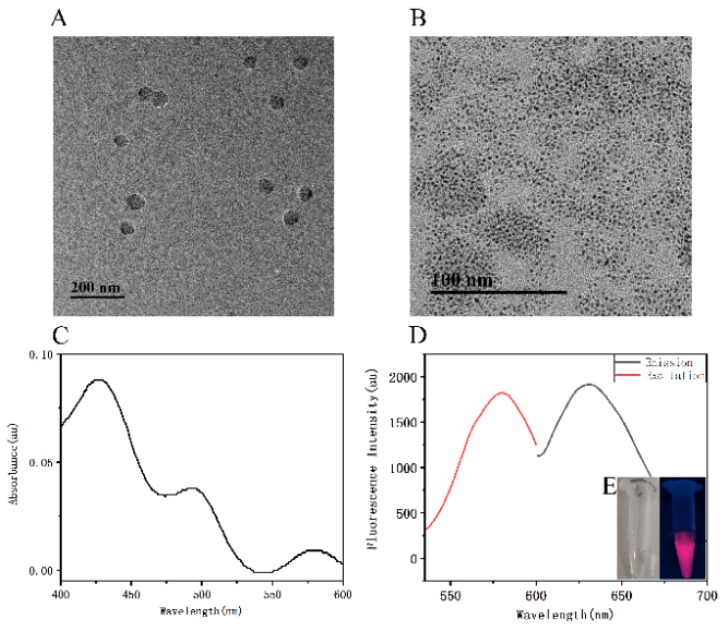
Figure 4.
Transmission electron microscopy (TEM) image of C6G5C6-apt-AgNCs (A) and PPyNPs (B). (C) UV–visible light (UV–Vis) absorption spectrum of the C6G5C6-apt-AgNCs. (D) The FI spectra of the excitation spectrum (red curve) and emission spectrum (black curve) of the C6G5C6-apt-AgNCs. Inset: the images of a C6G5C6-apt-AgNCs solution acquired under daylight (left) and UV light (right).

