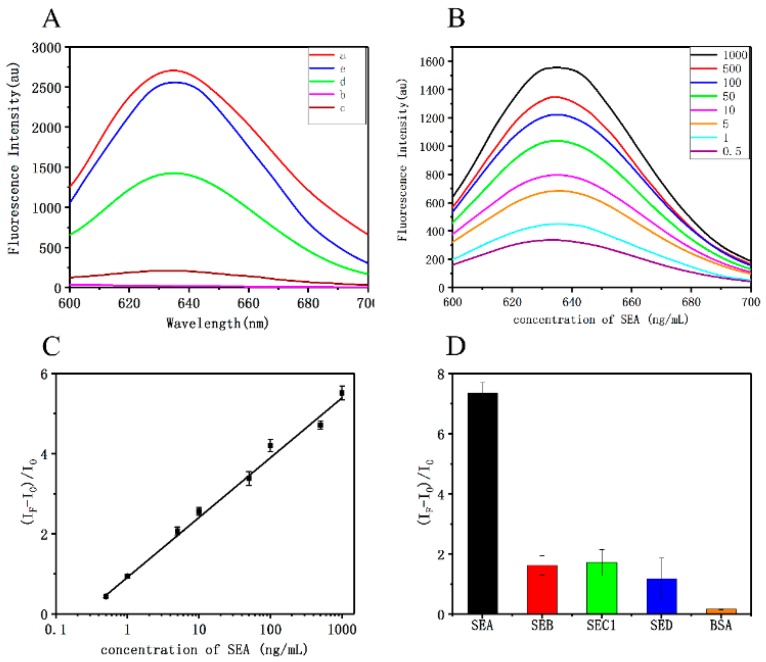
Figure 6.
(A) Fluorescence emission spectra of C6G5C6-apt-AgNCs under various conditions: (a) C6G5C6-apt-AgNCs (b) PPyNPs (c) C6G5C6-apt-AgNCs + PPyNPs (d) C6G5C6-apt-AgNCs + PPyNPs + SEA (e) C6G5C6-apt-AgNCs + SEA (C6G5C6-apt-AgNCs, 2.4 μM; PPyNPs, 8 mg/mL; SEA, 500 ng/mL). (B) Fluorescence spectra in the presence of increasing concentration of the target. (C) A linear relationship is obtained when the concentration of SEA is in the range of 0.5–1000 ng/mL. (D) Relative FI of the proposed bioassay for SEA and other toxins (SEB, SEC1, SED, bovine serum albumin (BSA)).

