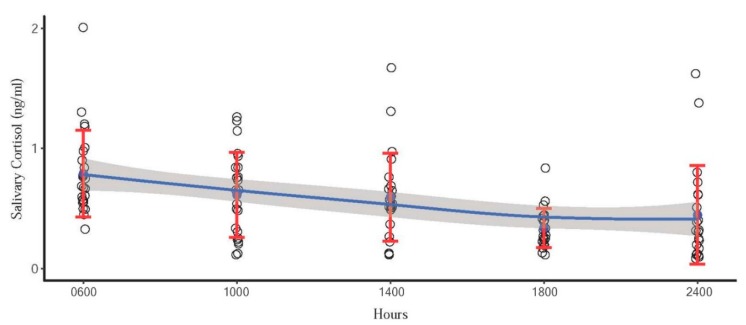
Figure 2.
Scatter plot indicating linear circadian pattern of cortisol concentrations in 10 Asian elephants. Blue dots represent the mean concentration of each time point. Red error bars represent the standard deviation. Blue line represents the trend line, and the shaded area is a 95% confidence interval of the mean.

