Figure 1.
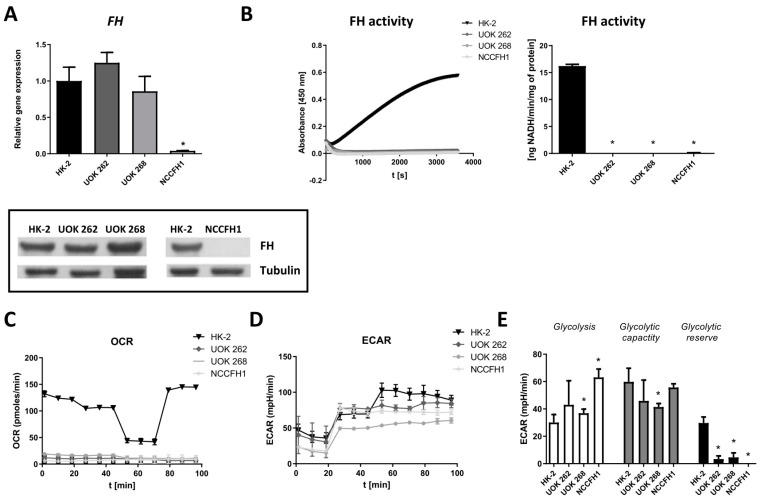
Characterization of fumarate hydratase (FH)-deficient cell lines. (A) qRT-PCR results (upper panel) and Western blot results (lower panel) for FH mRNA and protein level in UOK 262, UOK 268 and NCCFH1 cell lines in comparison to HK-2 cell lines. qRT-PCR results presented as relative fold change (mean ± SD). (B) FH activity in UOK 262, UOK 268, NCCFH1 and HK-2 cell lines, presented as absorbance changes over time (left panel) and ng NADH produced per minute by 1 mg protein (right panel) (mean ± SD). (C) Oxygen consumption rate (OCR) presented as a pmol/min and (D) extracellular acidification rate (ECAR) in UOK 262, UOK 268, NCCFH1, and HK-2 cell lines presented as an mpH/min. (E) Calculation of the typical glycolytic parameters based on Seahorse analysis: Glycolysis, glycolytic capacity, and glycolytic reserve shown as mpH/min (mean ± SD). * p < 0.05 vs. HK-2 cell line, Student’s t-test.

