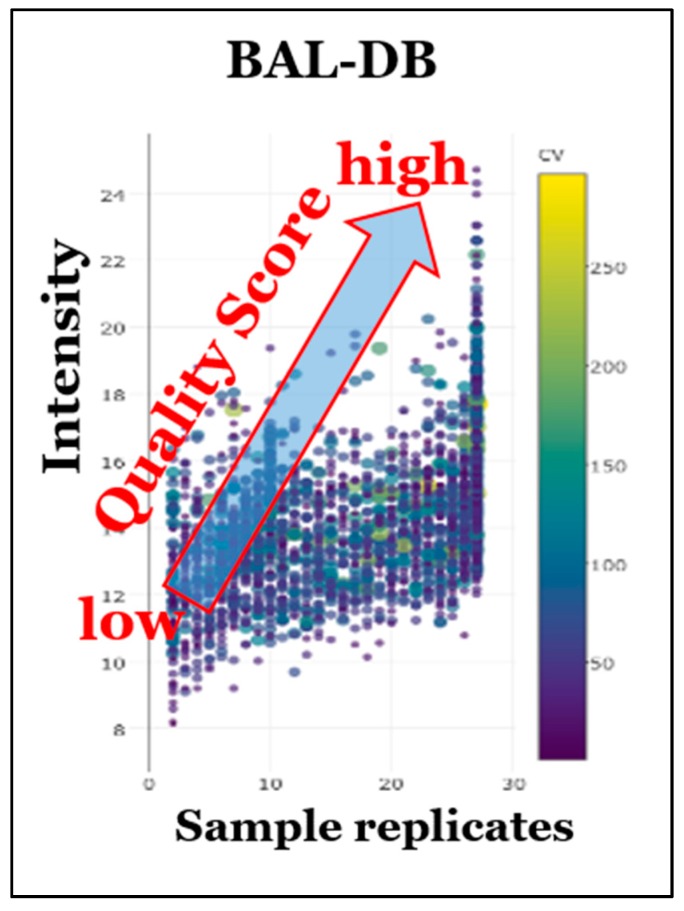
Figure 5.
Distribution plot of prototypic BAL-DB entries. This figure illustrates how CCC-QS increases as DF and intensity increase. Samples with a low number of detections and low intensity will have overall low QS, as seen in the bottom left of the plot. Conversely, a compound that is detected in all samples with high abundance will have a high QS, as seen in the top right of the plot. The colored bar on the right indicates the inverse coefficient of variability (CV), with yellow being a high %CV and blue being a low %CV. Even low intensity compounds will score higher if their DF is high.

