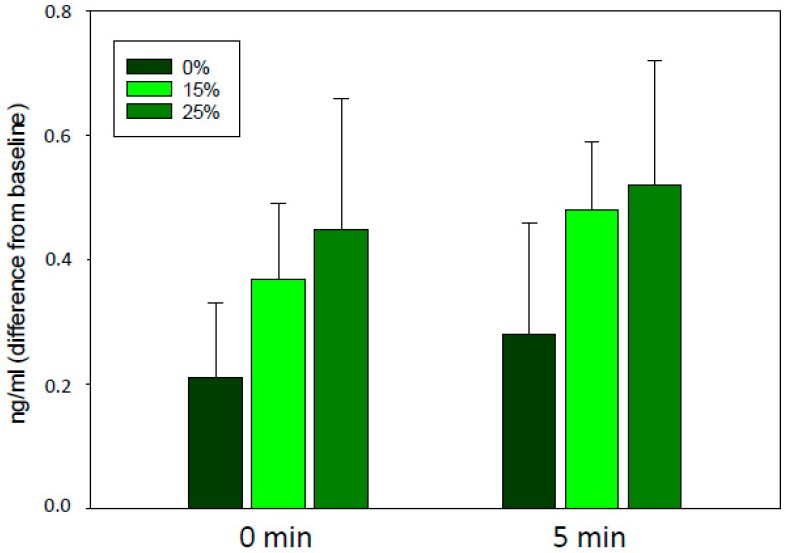
Figure 3.
Salivary cortisol concentrations of the 20 horses (ng/mL, mean ± se) calculated as the difference from baseline. 0% (control): The rider rode without additional weight; 15% and 25%: The rider rode with additional 15% or 25% of her bodyweight, respectively, in a balanced order across three test days. 0 and 5 min refer to the sampling time after the dressage test (0 min: F2 = 0.58, p = 0.56, 5 min: F2 = 0.66, p = 0.52).

