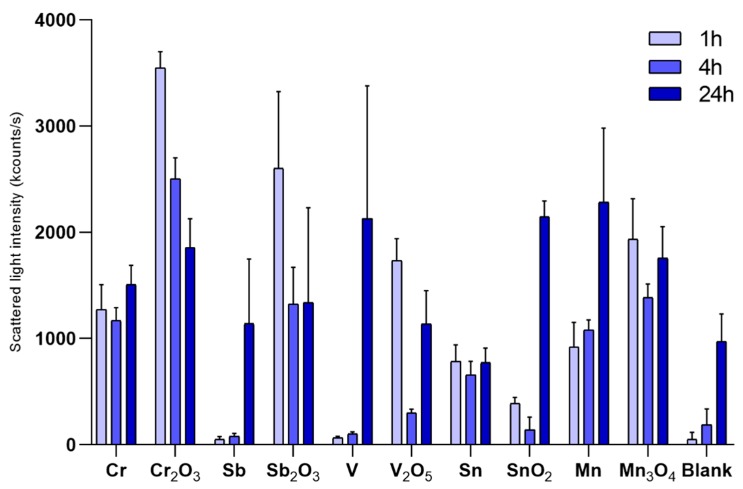
Figure 2.
Changes in scattered light intensities for the different metal and metal oxide NPs after 0, 2, and 24 h of exposure in cell medium recorded by means of PCCS. Particle loading: 100 µg/mL; Blank cell medium only without any NPs. The error bars represent the standard deviation based on three independent samples.

