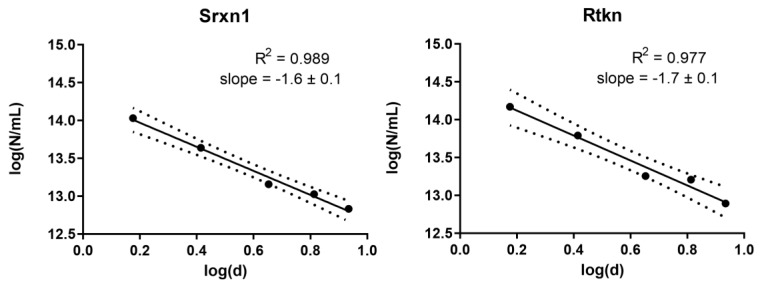
Figure 9.
Equi-response curves for CdTe QDs (1.5, 2.6, 4.5, 6.5, 8.6 nm) representing a 20% reduction in cell viability compared to control for Srxn1 and Rtkn reporter. Slopes are plotted according to the model proposed by Delmaar et al. [24] where N denotes the number of particles and d the diameter of the particle.

