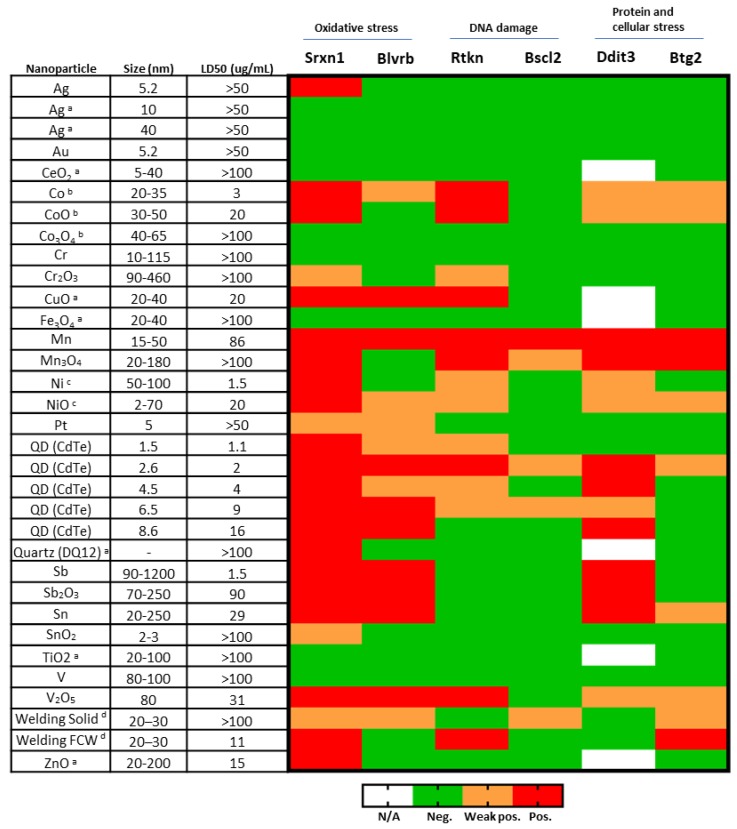
Figure 11.
Heatmap of ToxTracker activation of all NPs tested. Size is approximate and based on information from the supplier or TEM imaging. LD50 corresponds to 50% decrease in viability and is based on viability in Srxn1 reporter cells. Weak positive corresponds to >1.5 but <2 fold increase, while positive corresponds to > 2 fold increase at viability levels above 25%. a Karlsson et al. [10], b Cappellini et al. [12], c Akerlund et al. [11], d McCarrick et al. [13]; welded using solid or flux cored wire, respectively.

