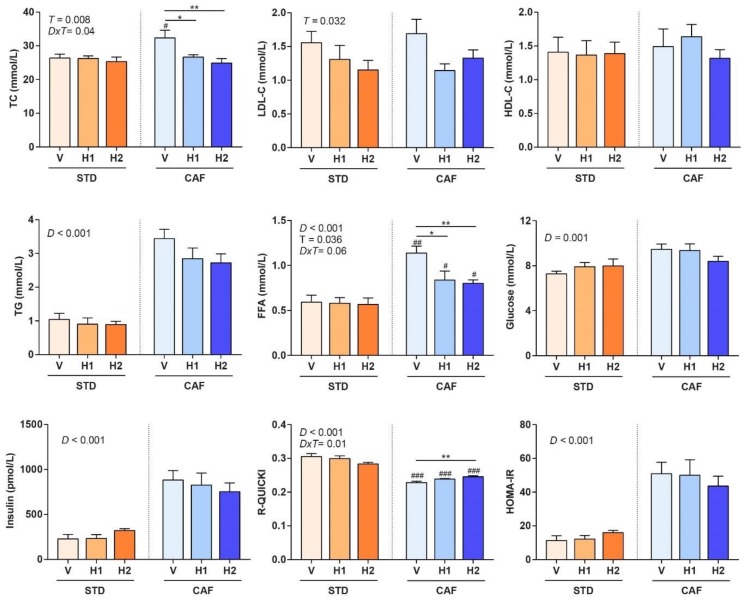
Figure 2.
End point (week 18) lipid and glucose metabolism biochemical parameters of rats that were fed with a standard (STD) or a cafeteria (CAF) diet and received a daily oral dose of vehicle (V), hesperidin at 40 mg/kg (H1), or hesperidin at 100 mg/kg (H2), for the last 8 weeks. Data are given as means ± SEM. D: Diet effect; DxT: diet-treatment interaction; T: treatment effect. # p < 0.05, ## p < 0.01, ### p < 0.001 vs the corresponding supplementation group in the STD diet model. * p < 0.05, ** p < 0.01 vs the V group in the same dietary model. FFA, free fatty acids; HOMA-IR, Homeostatic model assessment of insulin resistance; R-QUICKI, revised quantitative insulin sensitivity check index; TC, total cholesterol.

