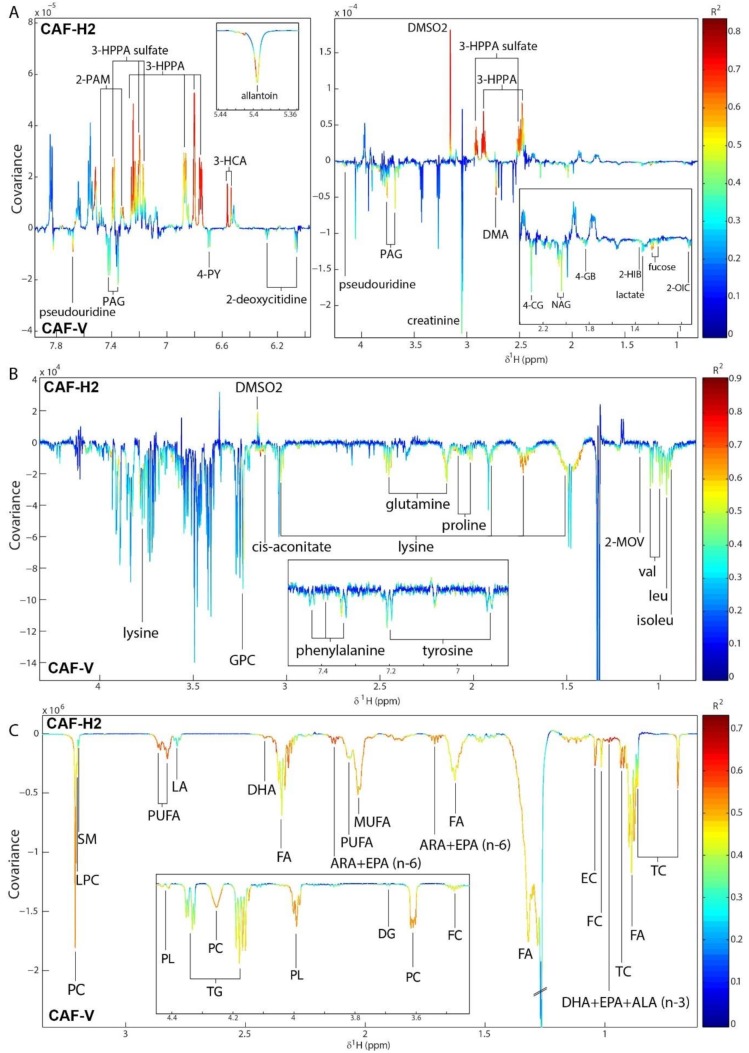
Figure 4.
Orthogonal projection to latent structures-discriminant analysis (OPLS-DA) coefficients plot comparing the (A) urine metabolic profiles, (B) the serum aqueous metabolic profiles, and (C) the serum lipid metabolic profiles of CAF-fed rats supplemented with either the vehicle (V) or hesperidin at 100 mg/kg (H2). The colour scale represents the significance of the correlation for each metabolite to the class membership with red indicating strong significance and blue indicating weak significance. 2-HIB, 2-hydroxyisobutyrate, 2-MOV; 3-methyl-2-oxovalerate; 2-OIC; 2-oxoisocaproate; 2-PAM, 2-phenylacetamide; 3-HCA, 3-hydroxycinnamic acid; 3-HPPA, 3-hydroxhyphenylpropionic acid; 4-CG, 4-cresol glucuronide; 4-GB, 4-guanidinobutanoate; ALA, α-linolenic acid; DG, diglycerides; ARA, arachidonic acid; DHA, docosahexaenoic acid; DMA, dimethylamine; DMSO2; dimethylsulfone; EC, esterified cholesterol; EPA, eicosapentaenoic acid; FA, fatty acids; FC; free cholesterol; GPC; glycerophosphocholine; LA, linoleic acid; LPC, lysophosphatidylcholines; MUFA, monounsaturated fatty acids; NAG, N-acetylglycoproteins; PAG, phenylacetylglycine; PC, phosphatidylcholines; PL, phospholipids; PUFA, polyunsaturated fatty acids; SM, sphingomyelins; TC, total cholesterol, TG, triglycerides.

