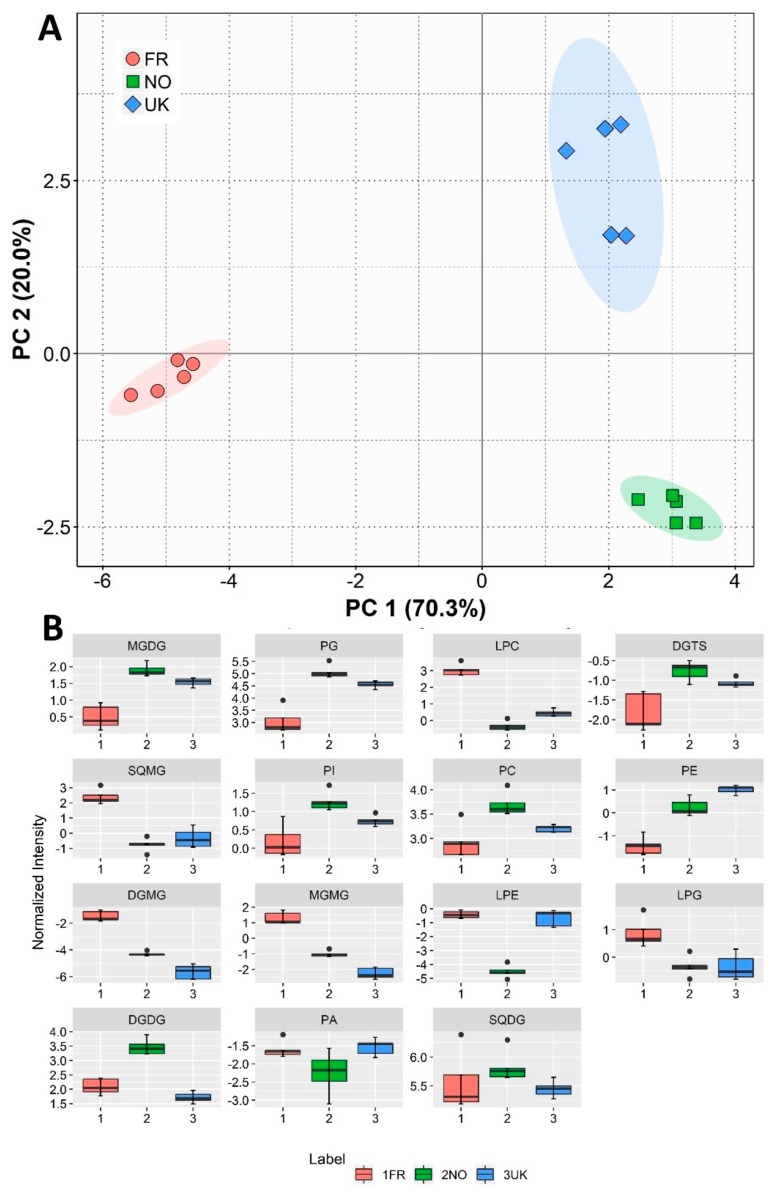
Figure 3.
Sample origin discrimination with regard to polar lipid class content. (A) Principal component analysis (PCA) score plot of lipid class totals (sum of normalized peaks for each lipid class) of Saccharina latissimi samples from different origins (FR—France, NO—Norway, UK—United Kingdom). (B) Box plots for the lipid classes present in S. latissimi samples from different origins, ranging from major to lesser contributors for Principal Component 1 of the PCA.

