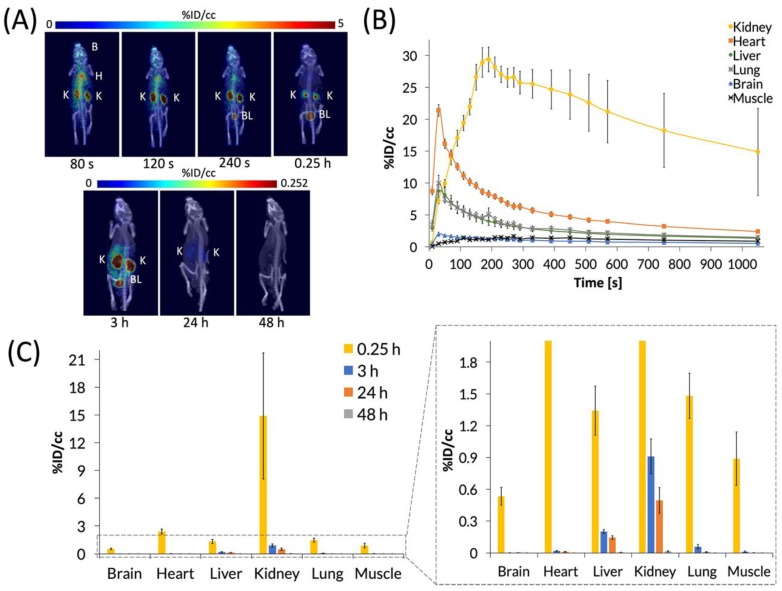
Figure 5.
PET images and biodistribution of C60-[64Cu]Cu(NOTA). (A) Whole-body dynamic and static PET images acquired at various time points post-injection (p.i.). Organs labeled are brain (B), heart (H), kidney (K), and bladder (BL); (B) Time activity curve (TAC) of 20 min dynamic scan showing initial biodistribution and rapid decrease in uptake in most organs; (C) Quantification of radioactivity in VOIs showing accumulation in various organs with a close-up view of the graph to highlight lower accumulation. Data represent mean ± SEM, n = 6.

