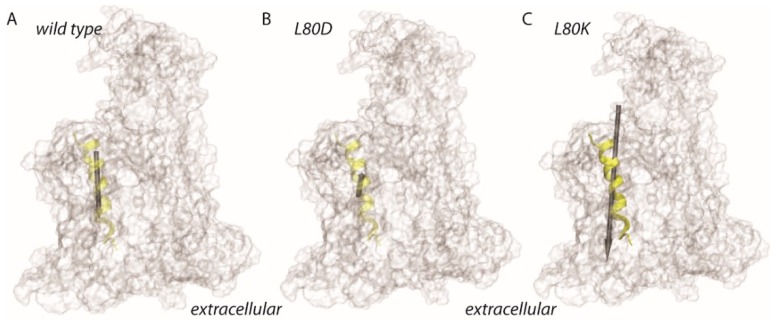
Figure 6.
Schematic representation of the dipole moment estimates for TM2b of E. coli SecY. Dipole moments were estimated for the amino acid residues A79-P100, which are depicted as a transparent yellow ribbon. The protein is shown as a transparent surface. (A–C) Dipole moment estimates for helix 2 of wild type SecY (62.4D, panel A), L80D (25.7D, panel B), and for L80K (153.1D, panel C). The size of the gray arrow indicates the relative size of the dipole moments.

