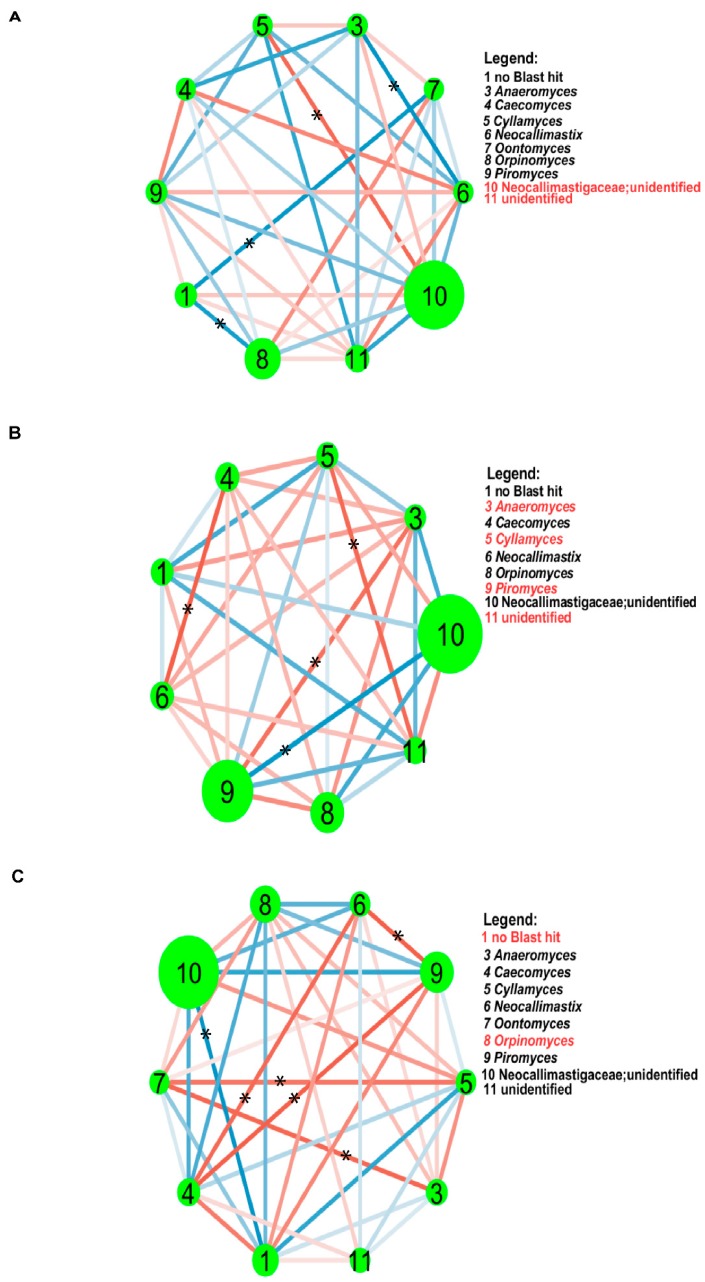
Figure 5.
The co-occurrence network analysis of rumen fungi in yak (A), Tibetan sheep (B) and Small Tail Han sheep (C). The size of each node is proportional to the relative abundance. Line in red and line in blue denote positive and negative correlations, respectively. The keystone species were colored by red in the Legend. The correlations between nodes which reached statistically significant levels (p < 0.05) were noted with an asterisk (*) in the Figures.

