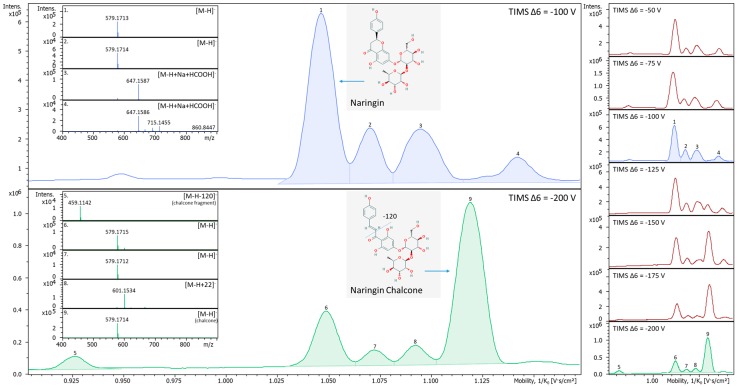
Figure 7.
Variations in naringin ion mobility spectra and MS spectra with increasing TIMS Δ6 voltages (right part of the figure). At the default setting of −100 V (blue trace, top left), there are at least four different ion species observed in the ion mobility spectrum indicated as peaks consisting of [M-H]− (peak 1), maybe a slightly larger or elongated conformer of [M-H]− (peak 2), and sodium plus formic acid adduct ([M-H+Na+HCO2−]−, peaks 3 and 4. The trace also contained additional unknown peaks and a dimer that are not shown. A peak emerges at 1.119 1/K0 as the TIMS Δ6 voltage is increased from −125 V gradually to −200 V (Green trace, bottom left). Peak 9, shown in the green trace, is an ion that emerged with greater TIMS Δ6 voltage and was not found initially during the analyses. The new peak (peak 9) has been putatively annotated as naringin chalcone. A chain breakage of the naringin likely occurred with the higher energies from the TIMS Δ6 voltage resulting in opening of the C ring and elongated naringin to naringin chalcone. The −120 ion is likely the further fragmentation of the chalcone chain breakage forming a separate mobility peak 5.

