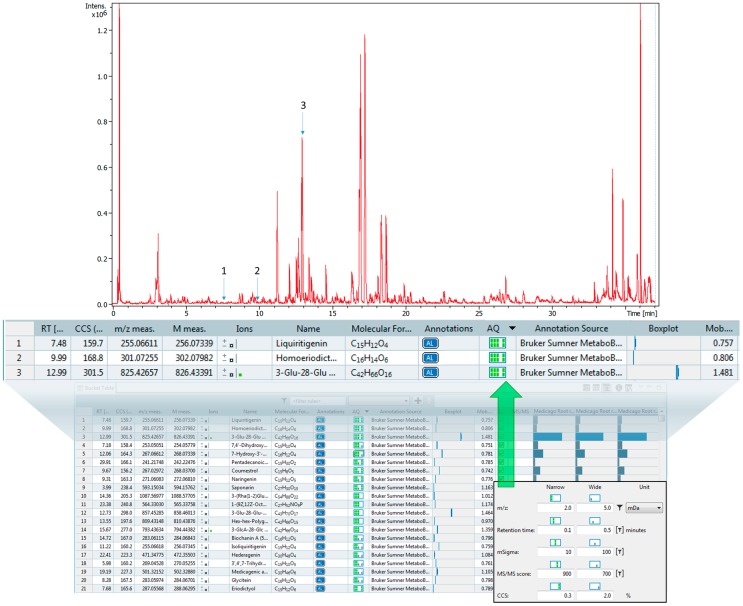
Figure 8.
A representative matching report using Bruker MetaboScape software. The annotation quality (AQ) column shows a color coded matching confidence of each of the parameters used in the search (from left to right): accurate mass, retention time, isotopic pattern (mSigma), MS/MS fragmentation, and CCS. Each column has a set of customizable matching parameters. If the first matching criteria is met the square is grey, if the narrower criteria is met both squares are green. The CCS matching is a new orthogonal data feature that expands the confidence in metabolite identifications. The bottom square alone that is grey represents a matching of less than 5% variation between the library and the measured value. Both squares green represents a matching less than 2% variation between the library and the measured value.

