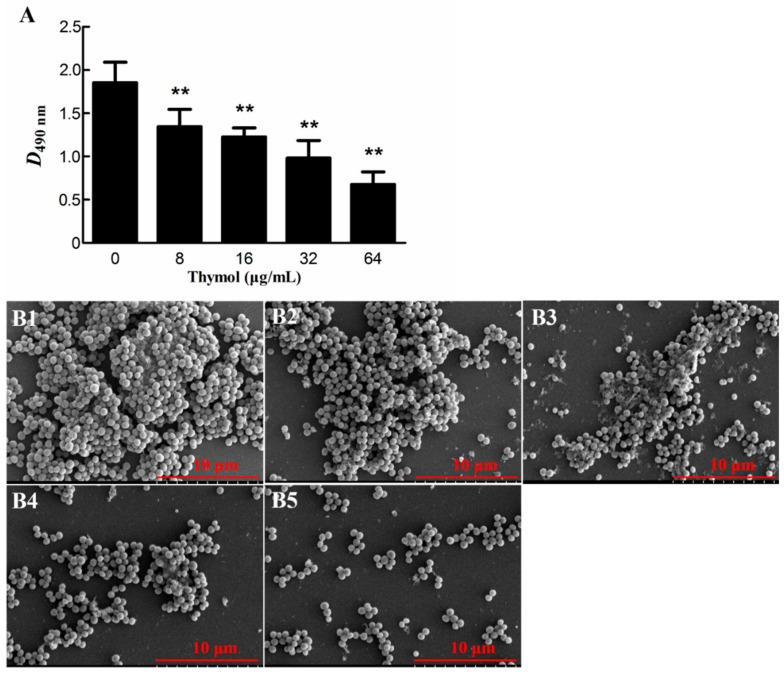
Figure 2.
Inhibitory effect of thymol on biofilm formation by TCH1516. (A) Results of crystal violet staining. (B) Scanning electron microscopy (SEM) images. Biofilms formed by cells treated with 0, 8, 16, 32, and 64 μg/mL thymol are shown in B1, B2, B3, B4 and B5, respectively. ** p < 0.01 compared with the 0 μg/mL group.

