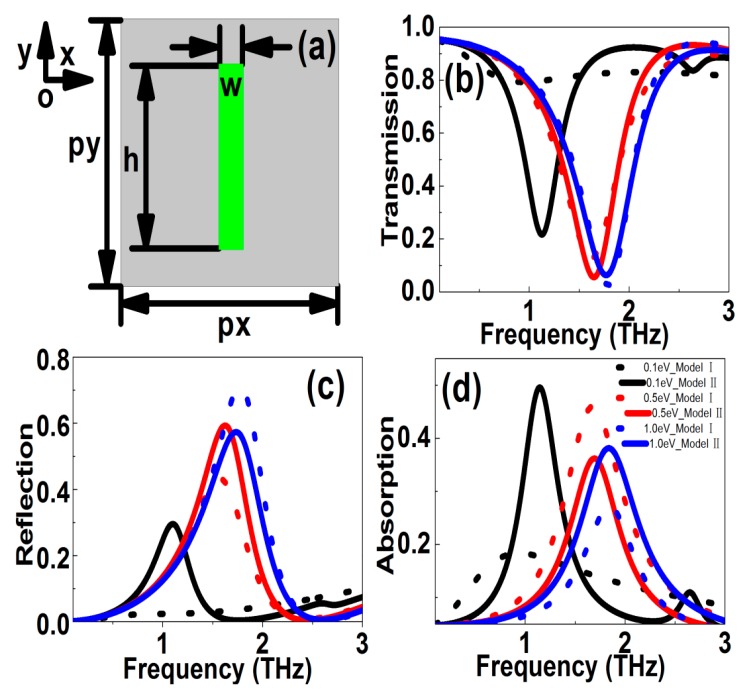
Figure 4.
(a) Sketch of graphene cut wire patterns. (b–d) The transmission, reflection, absorption resonant curves versus frequency at different models. The Fermi levels were 0.1, 0.2, 0.3, 0.4, 0.5, 0.6, 0.8, and 1.0 eV, respectively. The stripe length and width were 48 μm and 8 μm, respectively. The periodic lengths along x and y directions were both 72 μm.

