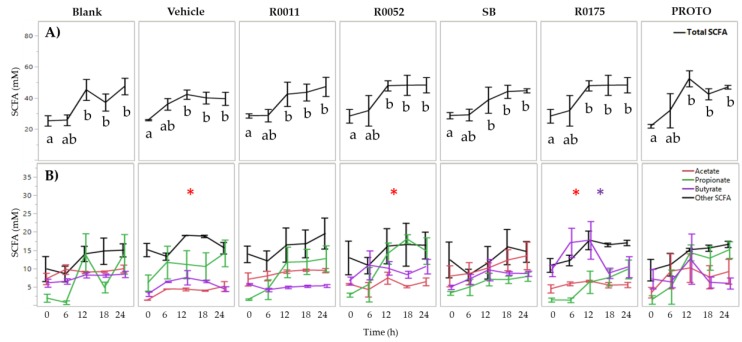
Figure 1.
Short-chain fatty acid (SCFA) analysis of normal FW. (A) Total SCFA quantification and (B) individual SCFA quantification. Values are presented as the means ± SEM. Means at time points within treatments without a common letter are significantly different (p < 0.05). The symbol * in red represents significant differences in acetate production between treatment and blank (p < 0.05) when the means of all time points are jointly considered. The symbol * in purple represents significant differences in butyrate production between treatment and blank (p < 0.05) when the means of all time points are jointly considered. R0011 = L. rhamnosus R0011; R0052 = L. helveticus R0052; SB = S. boulardii CNCM I-1079; R0175 = B. longum R0175; PROTO = ProtecFlorTM.

