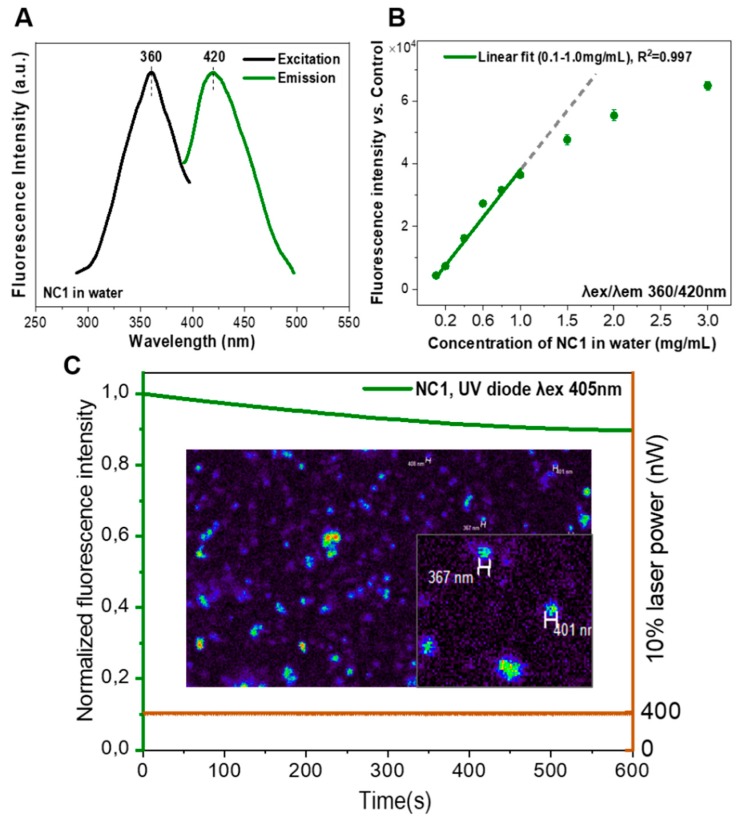
Figure 6.
(A) Excitation and emission spectra of the nanocapsules (NCs) water suspension; (B) fluorescence intensity of different concentrations of NCs measured by microplate reader (n = 2, values represent mean ± sd and subtract values of control non-fluorescence NCs); and, (C) photostability evaluation of NCs under confocal microscope at 10% laser power, fluorescence intensity expressed as the percentage vs. the value at the initial time, inset: NC1 water suspension observed at 60× lens.

