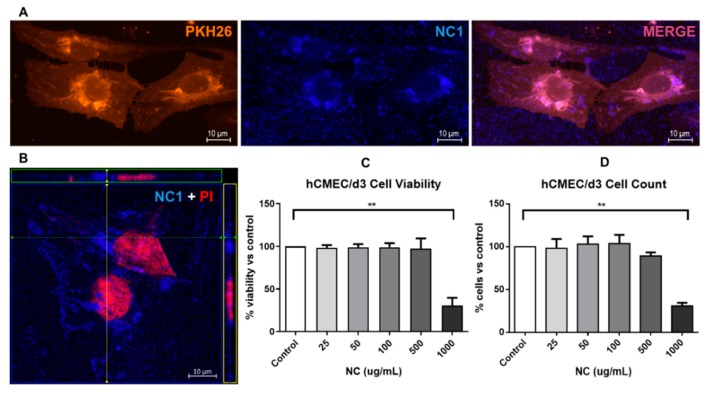
Figure 8.
NCs uptake and cytotoxicity in human brain endothelial cells. (A) Representative images of hCEMC/d3 cells stained with membrane dye PHK26 and exposed to 50 μg/mL of NC1 for 24 h (63× magnification); (B) Orthogonal view of a Z-stack of Propidium Iodide (PI) stained cells (showing the cell nuclei) and the fluorescent NCs; (C,D) hCEMC/d3 cells were treated for 48 h with different concentrations of NC1 and cell viability was determined with WST-8 reduction assay or tripsinized and counted in a Neubauer chamber, (n = 3–4, values represent mean ± SEM, ** p < 0.01).

