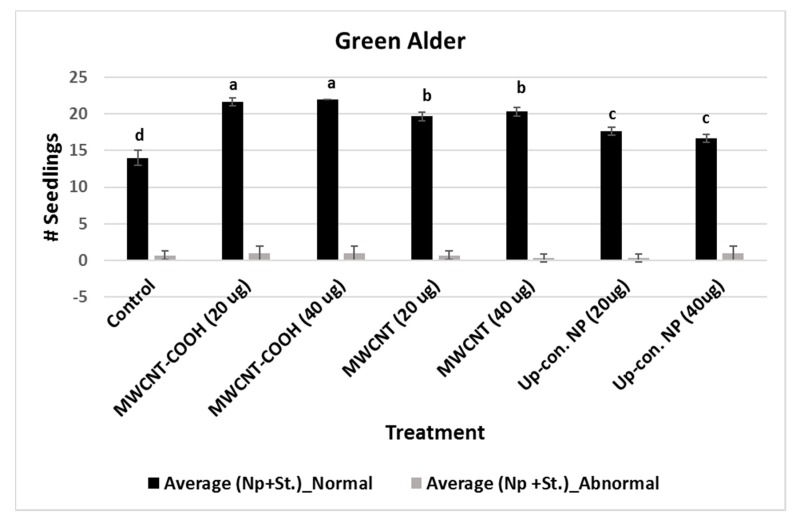
Figure 4.
Effects of different priming treatments on number of normal and abnormal seedlings in green alder. Each bar represents the number of seedlings ± standard errors. Different letters on vertical bars indicate significant differences at α = 0.05. Control = no CNPs added, MWCNT–COOH = multiwall carbon nanotubes functionalized with carboxylic acid, MWCNT = multiwall carbon nanotubes, UP-con NP = up conversion nanophosphors, N = 100 plants per treatment.

