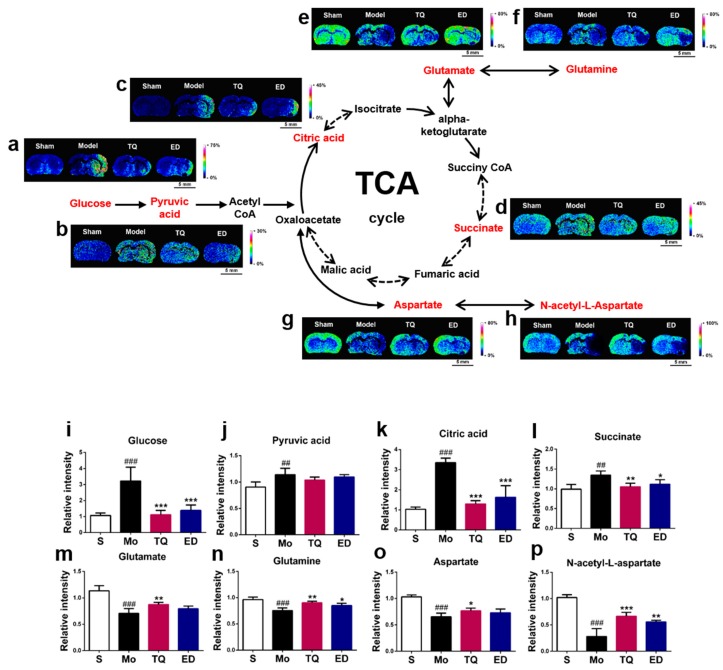
Figure 3.
In situ matrix-assisted laser desorption ionization mass spectrometry imaging (MALDI-MSI) distribution and changes in aerobic oxidation-related molecules and amino acids. (a–h) Representative MALDI-MSI images of metabolites, (i–p) statistical results of the relative changes in metabolites, with the relative intensity of each metabolite calculated by the average intensity ratio of the ischemic hemisphere to the contralateral hemisphere. (a,i) Glucose, (b,j) Pyruvic acid, (c,k) Citric acid, (d,l) Succinate, (e,m) Glutamate, (f,n) Glutamine, (g,o) Aspartate, (h, p) N-acetyl-L-aspartate. The spatial resolution of MALDI-MSI images is 200 μm, and the bar scale is 5 mm. Data are expressed as mean ± SD (n = 4), ## p < 0.01, ### p < 0.001 vs. sham group; * p < 0.05, ** p < 0.01, *** p < 0.001 vs. model group. S: Sham; Mo: Model; TQ: 5 mg/kg thymoquinone; ED: 3 mg/kg edaravone.

