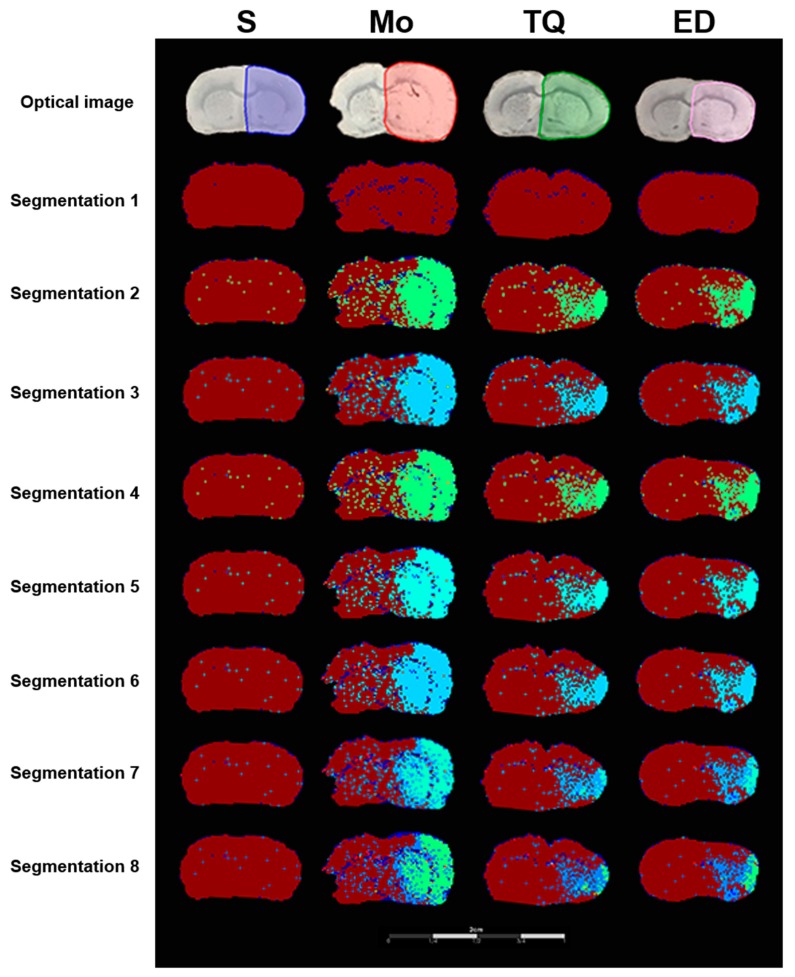
Figure 7.
Representative segmented cluster images of brain sections obtained using the SCiLS Lab software. Optical images represent the scanning image of the brain sections with the sprayed matrix. Regions of interest (ROI) were selected using different colors for MALDI semi-quantitative analysis. Segmentation 1 to 8 separated the ischemic regions and normal regions, and showed the degree of damage within ischemic regions. Cluster analysis separated the ischemia-damaged regions from normal regions, with different grades of cluster analysis further dividing the ischemic area. S: Sham; Mo: Model; TQ: 5 mg/kg thymoquinone; ED: 3 mg/kg edaravone.

