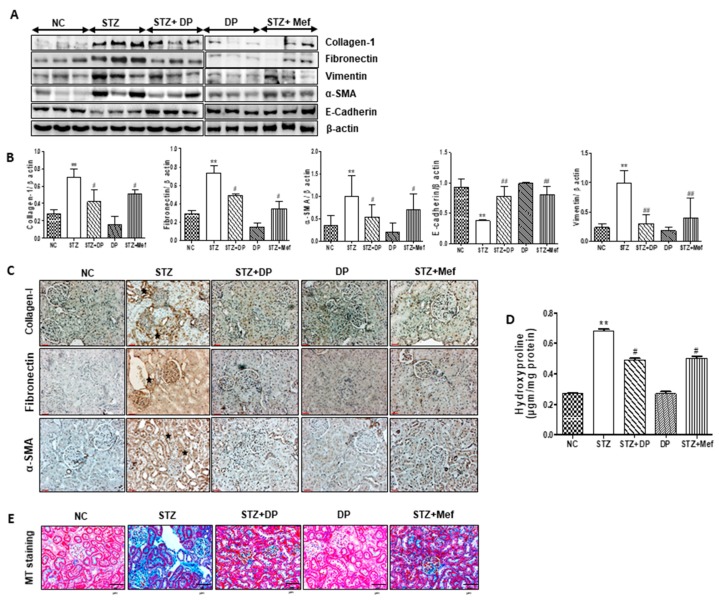
Figure 8.
Effect of DP extract on renal fibrous biomarkers in STZ-induced diabetic rats. (A) Expression levels of E-cadherin, collagen-1, alpha-smooth muscle antigen (α-SMA), α-tubulin, TGF-β, vimentin, and fibronectin were measured by Western blot analysis, using an experimental model of STZ-induced diabetic rats. β-Actin expression was used as the loading control. The Western blot results are representative of three separate experiments. (B) Representative graphs indicate the fold changes of Western blot data. Values are the mean ± S.D. of triplicate experiments. Statistical analyses were performed using one-way ANOVA followed by Tukey’s HSD post hoc test for multiple comparisons. ** p < 0.01 compared to the control group; # p < 0.05 and ## p < 0.01 compared to the STZ-treated group. (C) Representative immunohistochemical staining of collagen-1, fibronectin, and α-SMA in the kidney of STZ-induced diabetic rats. Stars represent collagen-1, fibronectin, and α-SMA-positive expression. Original magnification: 200×, scale bar: 100 μm. (D) 4-Hydroxyproline content in the serum of STZ-induced diabetic rats. Data are expressed as the means ± S.D. of duplicate experiments (6 animals/group). Statistical analysis was performed by one-way ANOVA followed by Tukey’s HSD post hoc test for multiple comparisons. ** p < 0.01 compared to control group; # p < 0.05 compared to STZ-treated group. (E) Representative Masson’s trichrome-stained kidney sections. Blue color represents collagen accumulation. Original magnification: 200×, scale bar: 100 μm. Original magnification: 100×, scale bar: 100 μm.

