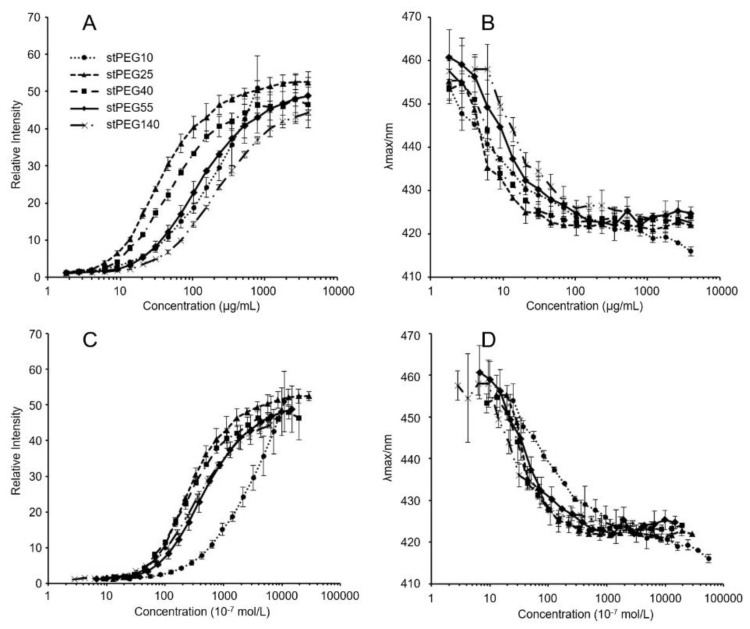
Figure 1.
Relative fluorescence intensities (A,C) and emission maximums (λmax) of PNA as functions (B,D) of the logarithmic mass (A,B) or molar (C,D) concentrations of stPEG10 (●), stPEG25 (▲), stPEG40 (■), stPEG55 (◆), and stPEG140 (×). The values are the means ± S.D. for groups, with the experiment performed in triplicate for each sample.

