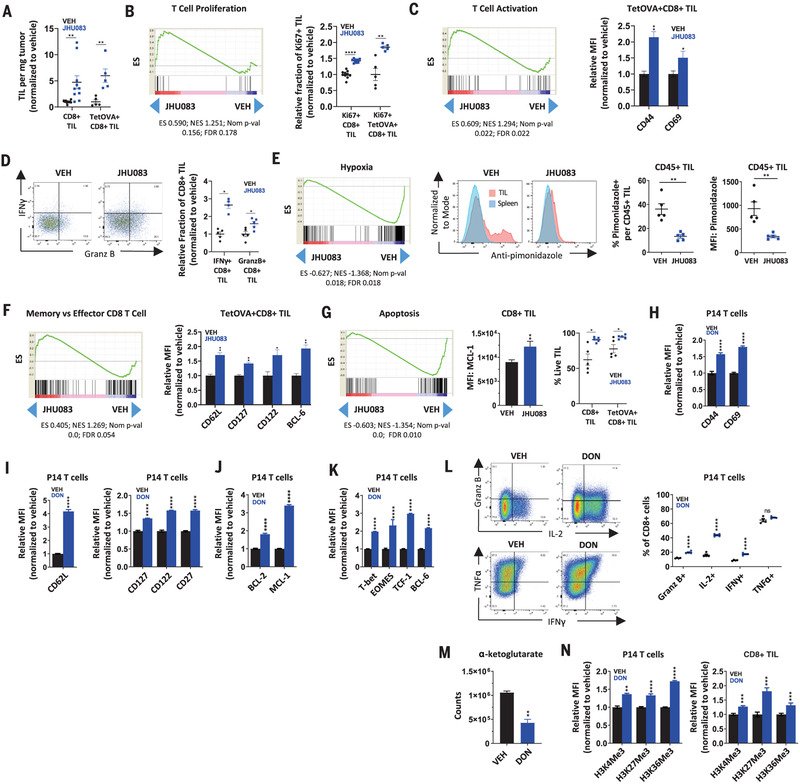
Fig. 2. Glutamine blockade conditions CD8+ TILs toward a highly proliferative, activated, and long-lived phenotype.
C57BL/6 mice with MC38 or MC38OVA tumors were treated on days 14 to 18 with vehicle or JHU083 (0.3 mg per kilogram of body weight per day) and sacrificed on day 18 for analysis. (A) Percentage of live CD8+ or TetOVA+CD8+ TILs per tumor weight for MC38 and MC38OVA models, respectively. TetOVA, tetramer-OVA. (B) GSEA tracing for positive regulation of αβ T cell proliferation (left) and percentage of Ki67+ cells per CD8+ in MC38 model or TetOVA+CD8+ in MC38OVA model (right). ES, enrichment score; NES, normalized enrichment score; FDR, false discovery ratio. (C) GSEA tracing for αβ T cell activation (left) and mean fluorescence intensity (MFI) of CD44 and CD69 of TetOVA+CD8+ TILs in MC38OVA model (right). (D) Relative fraction (normalized to vehicle) of IFN-g+ and granzyme B+ per CD8+ TILs from the MC38OVA model after ex vivo stimulation with SIINFEKL peptide for 4 hours. (E) GSEA tracing for hypoxic exposure (left) and FACS plots (center) and data summary (right) showing percentage of pimonidazole positive and pimonidazole MFI of CD45+ TILs in the MC38 model. (F) GSEA tracings for memory versus KLRG1high effector CD8+ T cells (left) and relative MFI of CD62L, CD127, CD122, and BCL-6 of TetOVA+CD8+ TILs (right). (G) GSEA tracing for apoptosis (left), MFI of MCL-1 on CD8+ in MC38 model (center), and live-cell percentage of CD8+ TILs in MC38 model and TetOVA+CD8+ in MC38OVA model (right). (H to K) Naïve P14 T cells activated in the presence of vehicle or DON (1 mM) for 2 days, rested in IL-2 for two additional days with vehicle or DON, and analyzed by FACS for activation markers (H), memory markers (I), survival markers (J), and transcription factors (K). (L) P14 T cells activated for 2 days as described and rested for 4 days in the presence of vehicle or DON before restimulation (with no drug present) for 4 hours. Flow plots (left) and data summary (right) for intracellular cytokines are shown. (M) Relative α-ketoglutarate levels at 36 hours post–P14 activation. (N) H3 histone trimethylation levels in P14 T cells 3 days post-activation (left) and CD8+ TILs (right). H3K4Me3, trimethylated histone H3 lysine 4; H3K27Me3, trimethylated histone H3 lysine 27; H3K36Me3, trimethylated histone H3 lysine 36. Error bars represent SEM. For MC38OVA experiments, FACS data are representative of two or three independent experiments with n = 5 mice per group. For MC38 experiments, FACS summary plots are combination data from two independent experiments with n = 5 mice per group. For RNA-seq, data are from treated and untreated groups of five mice in each group. In vitro experiments are representative of three to five independent experiments with n = 3 to 6. *p < 0.05, **p < 0.01, ***p < 0.001, ****p < 0.0001, and ns is not significant using two-tailed Student’s t test.

