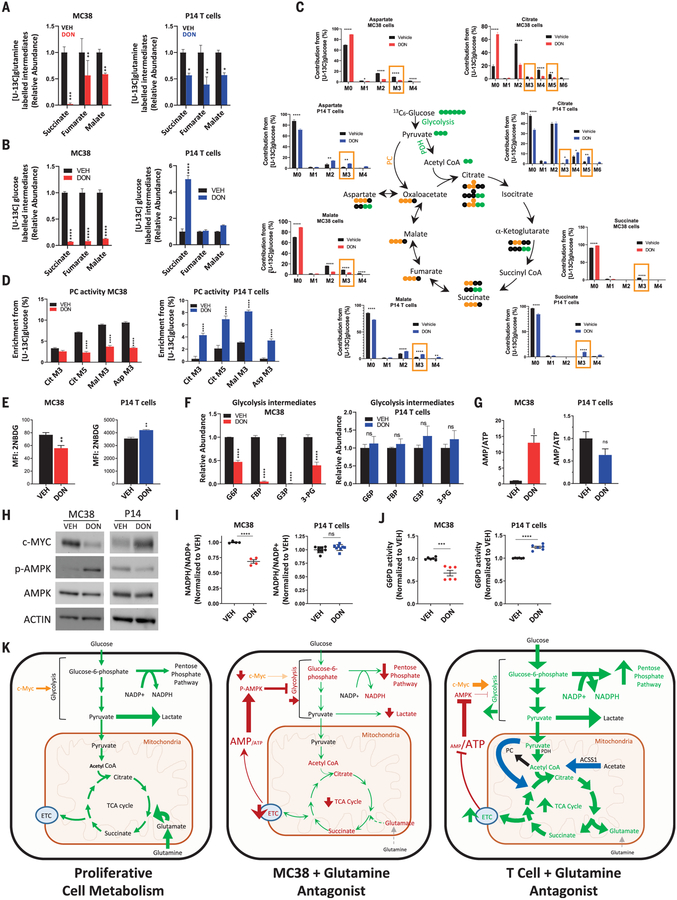
Fig. 4. In response to glutamine blockade, activated CD8+ T cells, but not MC38 tumor cells, replenish TCA intermediates by up-regulating glucose anaplerosis.
(A to J) Metabolic characteristics of vehicle- versus DON-treated MC38 cells (red) and vehicle- versus DON-treated activated P14 CD8+ T cells (blue) in vitro. Relative abundance of labeled intermediates of the TCA cycle during [U-13C] glutamine (A) and [U-13C] glucose (B) tracing experiments. LC-MS analysis of TCA intermediates with [U-13C] glucose tracing (C). For (C), in the bar graphs, M3 and M5 values enclosed in yellow rectangles correspond to isotopologs indicative of PC activity, and in the TCA cycle diagram, PDH is pyruvate dehydrogenase; green and yellow circles indicate carbon atoms derived from PDH and PC activity, respectively; and black circles indicate unlabeled carbon atoms. Relative labeling of TCA isotopologues characteristic of PC activity (D). 2-NBDG uptake by flow cytometry analysis (E). Relative abundance of glycotic intermediates in MC38 (left) and P14 T cells (right) (F). G6P, glucose-6-phosphate; FDP, fructose-1,6-bis-phosphate; G3P, d-glyceraldehyde 3-phosphate; 3-PG, d-glycerate 3-phosphate. Relative AMP/ATP ratio (G). Western blot of c-MYC, phospho-AMPK, and total AMPK expression (H). ACTIN is used as a loading control. Relative NADP+/NADPH ratio (I). Relative G6PD activity (J). Error bars represent SEM. Data are representative of three or four independent experiments [(E), (H), (I), and (J)] with n = 3 or 4 [(E), (I), and (J)]. (G) is abundance data compiled from three independent tracing studies. *p < 0.05, **p < 0.01, ***p < 0.001, ****p < 0.0001, and ns is not significant using two-tailed Student’s t test. (K) Model depicting relative activity of fundamental metabolic pathways in highly proliferative cells (left), glutamine-inhibited MC38 cancer cells (center), and glutamine-inhibited effector CD8+ T cells (right). Highly proliferative cells in nutrient-rich microenvironments engage high levels of aerobic glycolysis (Warburg physiology), PPP activity, and glutaminolysis to maintain energy, redox, and metabolite homeostasis. Disruption of glutamine metabolism in MC38 cells leads to increased AMP/ATP ratio and decreased c-MYC, such that proximal glycolytic metabolism is suppressed and cells can no longer rely on Warburg physiology, the PPP, or TCA cycle activity. By contrast, activated T cells adapt to glutamine blockade and maintain redox and energy homeostasis by up-regulating OXPHOS through acetate catabolism, generating high levels of acetyl-CoA as a two-carbon source for the TCA cycle, and up-regulating PC activity for glucose anaplerosis. ETC, electron transport chain.

