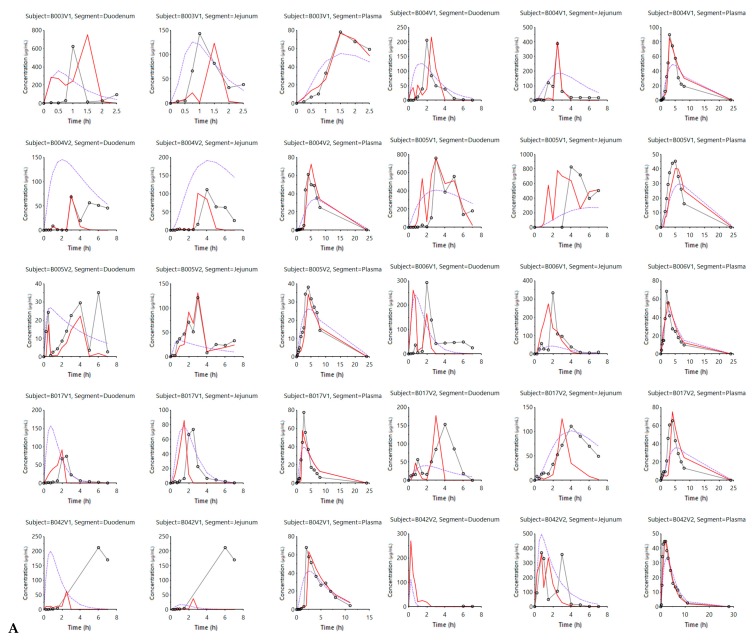
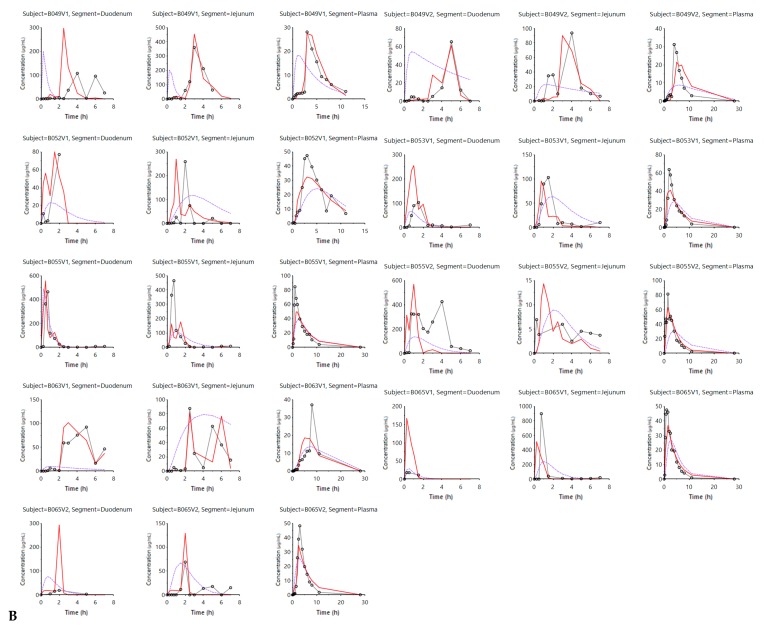
Figure 2.
(A) and (B) describe the experimental and model-fitted concentration values of ibuprofen for all subjects. Experimental (black dots) and model-fitted concentration values of ibuprofen in the duodenal, jejunal and systemic compartments for each and every subject in fasting state conditions. Each row includes the observed and simulated concentration–time profiles in the duodenal, jejunal and plasma segments in three separate columns. The purple line reflects the InVivo_GIS model-predicted values, whereas the red line corresponds with the simulated (model-fitted) values derived from the InVivo_GISPlus model. The experimental values are reflected by the dark grey lines and dots.


