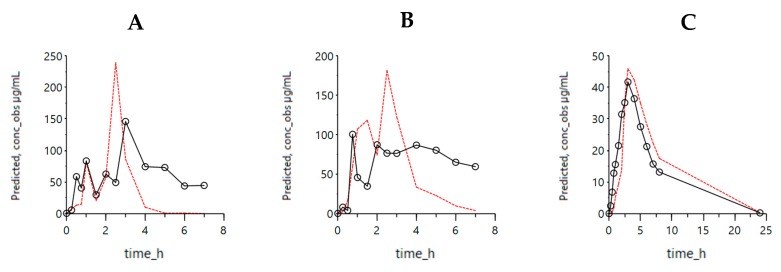
Figure 3.
Simulated outcomes of the average concentrations using the InVivo_GISPlus model. Average experimental ibuprofen concentrations are shown by the black dots in the duodenum (A), jejunum (B) and plasma (C) across all the subjects. Simulated values of the InVivo_GISPlus model are represented with red lines. The experimental values are reflected by the dark black lines and dots.

