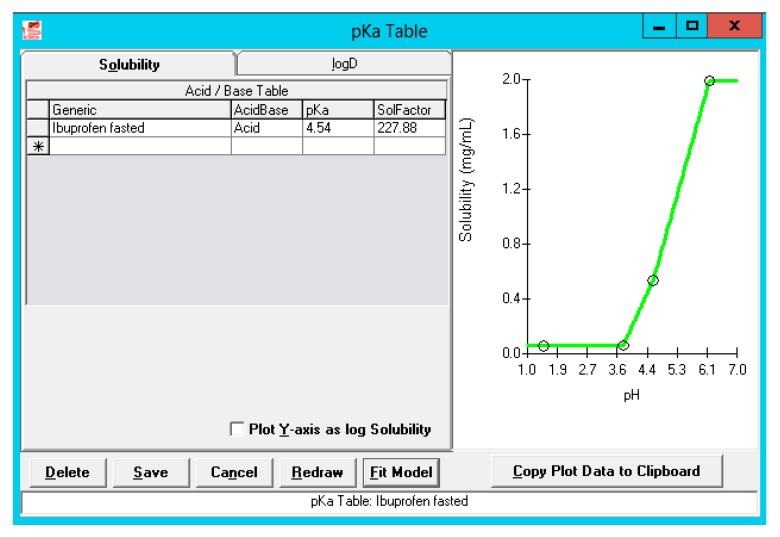
Figure 7.
Solubility versus pH profile for ibuprofen. The green line represents the predicted solubility versus pH curve, whereas the blue dots represent the measured solubility values in fasted-state human GI fluids. The upper blue dot is a solubility value of ibuprofen measured in fasted-state duodenal fluid by Heikkilä and co-workers [28].

