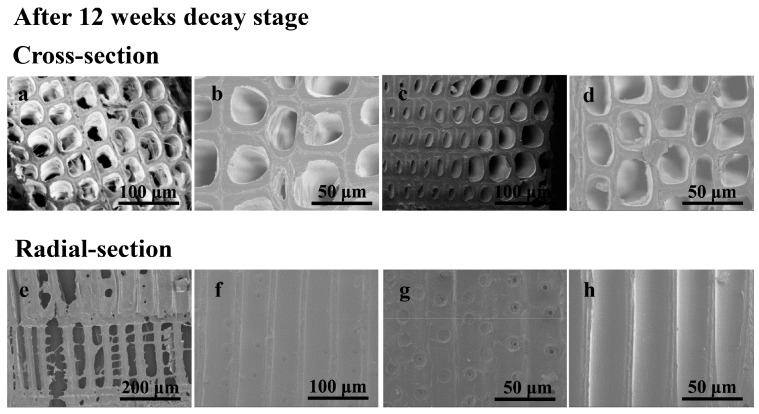
Figure 4.
SEM photographs of wood samples after 12 weeks decay stage. Cross-section: (a), control sample, (b), sample treated with P1, (c), sample treated with P2, (d), sample treated with P3; Radial-section: (e), control sample, (f), sample treated with P1, (g), sample treated with P2, (h), sample treated with P3.

