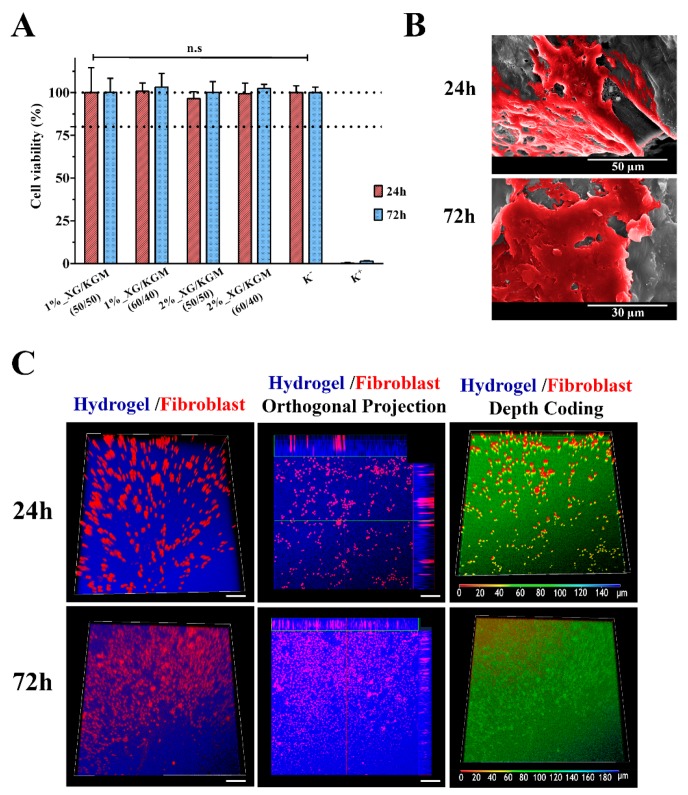
Figure 6.
Characterization of the cytocompatibility of the hydrogels. (A) MTT assay of human fibroblast cells grown in the presence of different hydrogels. Wells treated with ethanol were used as positive controls. n.s: no statistically significant groups. The data are shown as means ± standard deviations (n = 3). (B) Representative SEM images of fibroblast cell adhesion and proliferation on the surface of the 1%_XG/KGM_(60/40) hydrogel, after 24 h and 72 h of incubation. (C) Confocal laser scanning microscopy (CLSM) images of cell internalization in 1%_XG/KGM_(60/40) after 24 h and 72 h, where different colors correspond to distinct depth values (as indicated in the color-coding scale).

