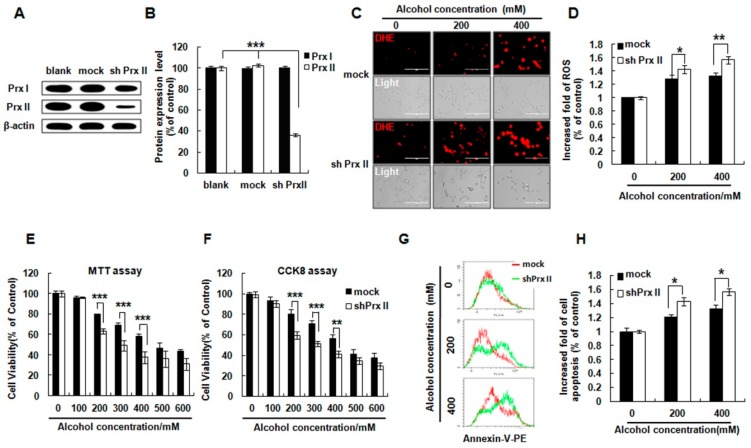
Figure 1.
Effect of Peroxiredoxin II (Prx II) on cell viability, cellular ROS, and apoptosis in HT22 cells after alcohol stimulation. (A) The Western blot analysis of Prx I and Prx II expression in blank, mock, and shPrx II HT22 cells. (B) The protein expression levels were quantified using ImageJ software and the differences are represented by histogram; β-actin was used as a loading control (means ± SE of three independent experiments) (** p < 0.01) (C) The cellular ROS levels were detected by DHE (red) staining, a dye for cellular ROS detection (Scale bar = 200 μm). (D) Intracellular ROS production was measured by flow cytometry following staining with DHE dye; bar graphs show quantitative analysis of mean values from three independent experiments. (* p < 0.05; ** p < 0.01). (E,F) Mock HT22 cells and shPrx II HT22 cells were cultured in different concentrations of alcohol (0–600 mΜ) for 24 h. Cell viability was measured by 3-(4,5-dimethyldiazol-2-yl)-2, 5-diphenyltetrazolium bromide (MTT) and Cell Counting Kit-8 (CCK8) assay. Each value represents the mean (±SEM) from at least three independent experiments (*** p < 0.001, ** p < 0.01). (G,H) Cellular apoptosis was measured with flow cytometry as fluorescence intensity of Annexin V-PE. The bar graphs show the quantitative analysis of mean values in (G) from three independent experiments (* p < 0.05).

