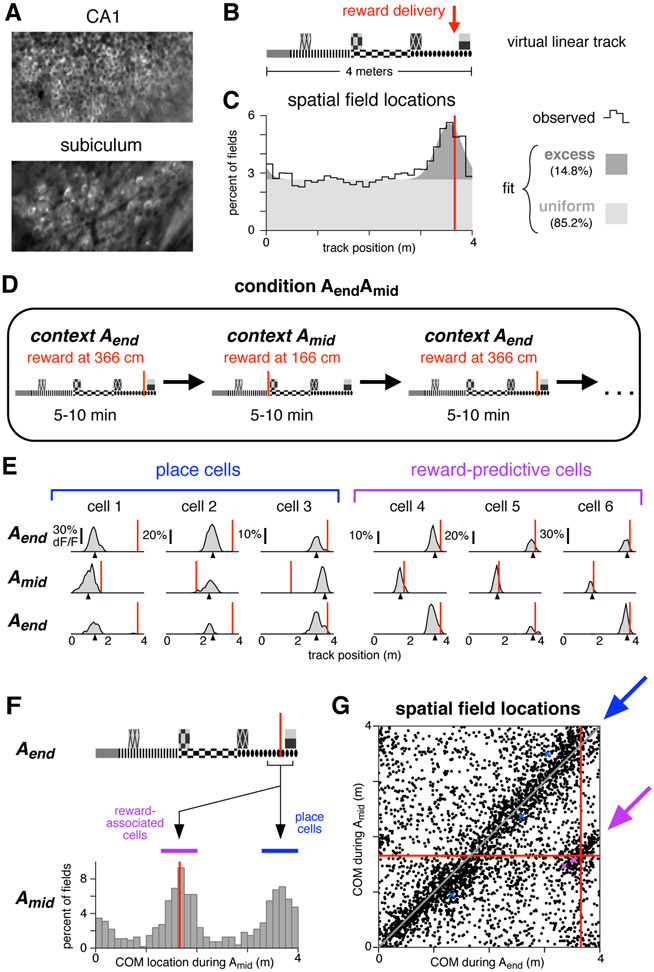
Figure 1: A distinct population of hippocampal neurons are consistently active near reward.
(A) Typical fields of view in CA1 and subiculum of neurons expressing GCaMP3. Image widths are 200 um.
(B) Schematic of the virtual linear track and reward delivery location.
(C) COM locations of all cells with a spatial field during condition Aend (9,761 cells, 11 mice). Black line shows observed density, gray patches show density of a fitted mixture distribution consisting of a uniform distribution (light gray) and a Gaussian distribution (dark gray, mean 355 cm, s.d. 25 cm).
(D) Schematic of condition in which reward delivery shifted between two locations.
(E) Activity of six simultaneously-recorded CA1 neurons during the first three blocks of one session of condition AendAmid. Each column shows the spatially-averaged activity of one cell in the first (top), second (middle), and third (bottom) blocks. Activity on each traversal was spatially binned (width 10 cm), filtered (Gaussian kernel, radius 10 cm) and averaged (70th percentile) across all traversals, excepting the first three traversals of each block. Black arrowheads indicate COM location computed by pooling trials from all blocks of a single context (Aend or Amid, see Methods). Red lines indicate reward location in each block.
(F) Top: track diagram. Bottom: COM locations during Amid of cells with a spatially-modulated field located within 25 cm of reward during Aend (square bracket beneath track diagram, 1,171 cells, 6 mice). Red lines indicate reward location, colored bands indicate clusters of reward-associated cells (purple) or cells whose field remained in the same location (blue). Similar results were obtained when considering CA1 and subiculum separately (Figure S1C).
(G) The COM locations of all cells with spatial fields during both Aend and Amid (3,842 cells, 6 mice). Red lines indicate reward location. Arrows indicate regions defining reward-associated cells (purple) and place cells with stable field locations (blue). Colored markers indicate the COM locations of the examples in panel E. Similar results were obtained when considering CA1 and subiculum separately (Figure S1D).

