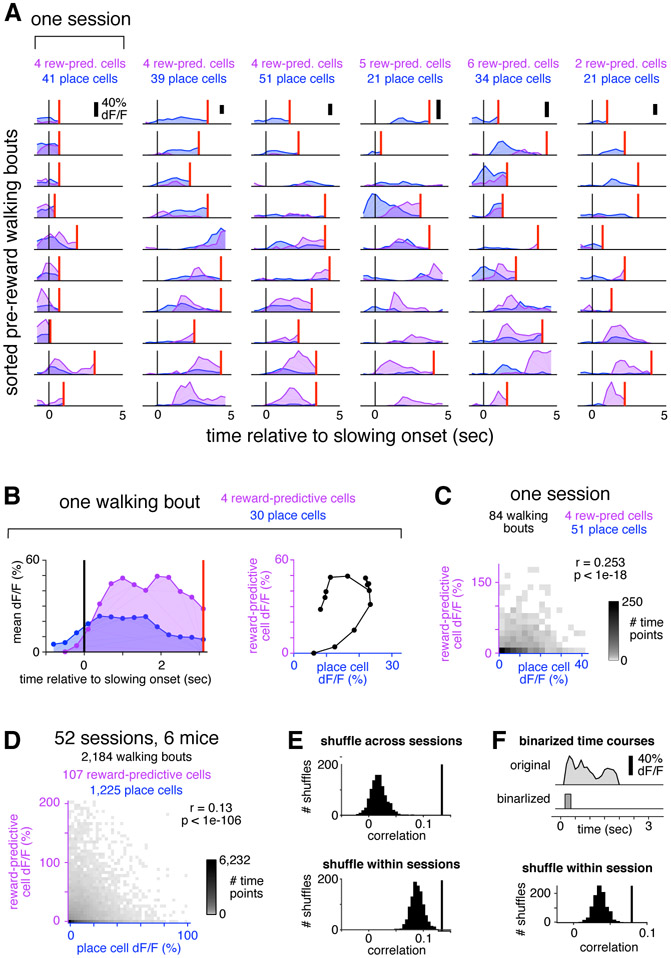
Figure 4: Place cells and reward-predictive cells were active simultaneously.
(A) For each of 6 sessions (columns) from 4 mice, 10 representative pre-reward walking bouts (rows) are shown. For each bout, colored traces show activity averaged across all reward-predictive cells (purple) or reward-adjacent place cells (blue). Bouts are sorted according to the fraction of total activity that arose from place cells (most to least). Activity was averaged in 0.3 second bins, and is shown beginning one second prior to the onset of slowing (black vertical line) until reward delivery (red vertical line), or at most 5 seconds. On many bouts, reward cells and place cells were active simultaneously.
(B) Example illustrating how the activity of each bout is summarized in the population analysis of panel (C). For a single bout (left panel, same conventions as in (A)), activity is plotted as a scatter (right panel) comparing place cells (horizontal) to reward-predictive cells (vertical).
(C) Two-dimensional histogram summarizing activity from all pre-reward walking bouts in one session. Place and reward-predictive cells were frequently active simultaneously, and their activity was significantly correlated.
(D) Two-dimensional histogram summarizing activity from all pre-reward walking bouts during condition AendAmid, same conventions as in (C). To enhance readability, tails of the distribution (0.3% of time points) are not shown. The activity of place cells and reward-predictive cells was significantly correlated, indicating a tendency for the two populations to be active stimultaneously.
(E) Control to ensure that the positive correlation was not due to place cells and reward-predictive cells having a similar time course. When activity was shuffled across all sessions (upper panel), the distribution of correlations (black histogram) was lower than the observed value (black vertical line). This was also true when activity was shuffled only within each session (lower panel).
(F) Control to ensure that the correlation was not due to the residual fluorescence time course following cessation of activity. For each cell, the original time course was binarized by zeroing all time points following the initial rise in each transient, and setting the amplitude of all non-zero points to 1 (upper panel, see Methods). After using these binarized time courses to perform the same analysis as in the bottom of panel (E), there was still a significant correlation between the activity of reward-predictive cells and place cells (lower panel). These results show that reward-adjacent place cells and reward-predictive cells were not anti-correlated, and in fact the two populations tended to be active simultaneously more often than expected by chance.

