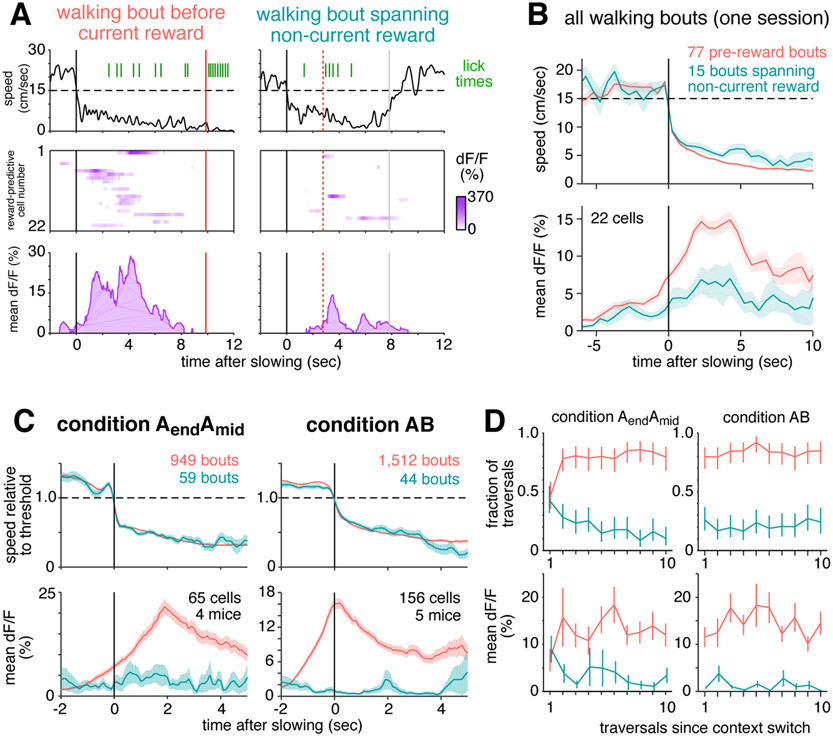
Figure 6: Reward-predictive cell activity can not be explained by reward anticipation behavior.
(A-B) Activity is shown for the same 22 simultaneously-recorded reward-predictive cells depicted in Figure 5a.
(A) Instantaneous movement speed (top), activity of each reward-predictive cell plotted in the same order as in Figure 5a (middle), and population mean activity (bottom) during two walking bouts, preceding the current (left) or non-current reward location (right). Black lines indicate onset of walking, red lines indicate reward, and gray lines indicate the end of the unrewarded walking bout.
(B) Top: Movement speed averaged over all walking bouts from this session, excluding the first three traversals of each block, grouped by whether they preceded current (pink) or non-current (blue-green) reward. Bottom: Simultaneous activity of reward-predictive cells. Single trial traces were averaged in half-second chunks before combining across trials, bands show standard error of the mean across trials.
(C) Average speed relative to slowing threshold (top panels) and average activity of reward-predictive cells (bottom). Only includes sessions in which reward-predictive cells were recorded. A subset of bouts was manually chosen (see Methods) to maximize the similarity of average speed; for all bouts, see Figure S6. Condition AendAmid only includes data from day 7 of training or later to ensure mice were familiar with the reward delivery paradigm.
(D) Comparison of how quickly slowing behavior and reward-predictive cell activity adapt to a new context. Condition AB only includes data from track A. Top: fraction of traversals in which mice exhibited a pre-reward walking bout (pink) or an unrewarded walking spanning the non-current reward location (blue-green). Error bars indicate 95% confidence interval. Bottom: mean fluorescence of reward-predictive cells in the first 5 seconds after slowing onset, error bars show standard error of the mean.

