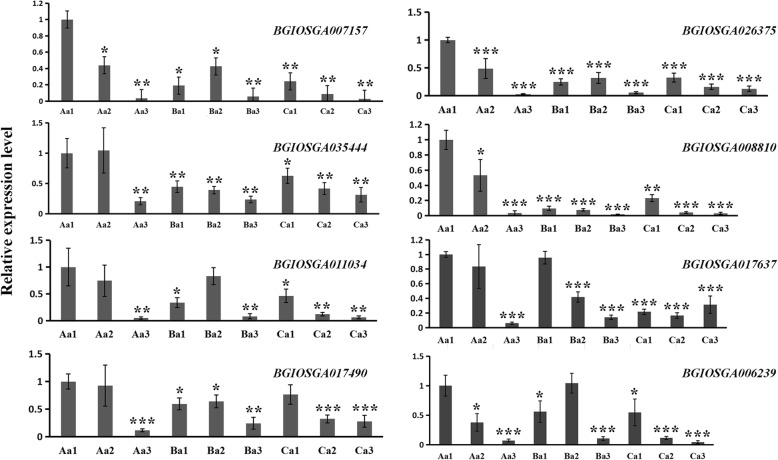
Fig. 7.
The expression levels of differentially abundant proteins in axillary buds before and after the yellow ripe stage as assessed by a qRT-PCR analysis. Values presented are the means ± SDs from three different duplicates (n = 3). Significant differences from 3 d before the yellow ripe stage of Minghui 63 are indicated by asterisks (Student’s t-test, *P < 0.05, **P < 0.01, ***P < 0.001)

