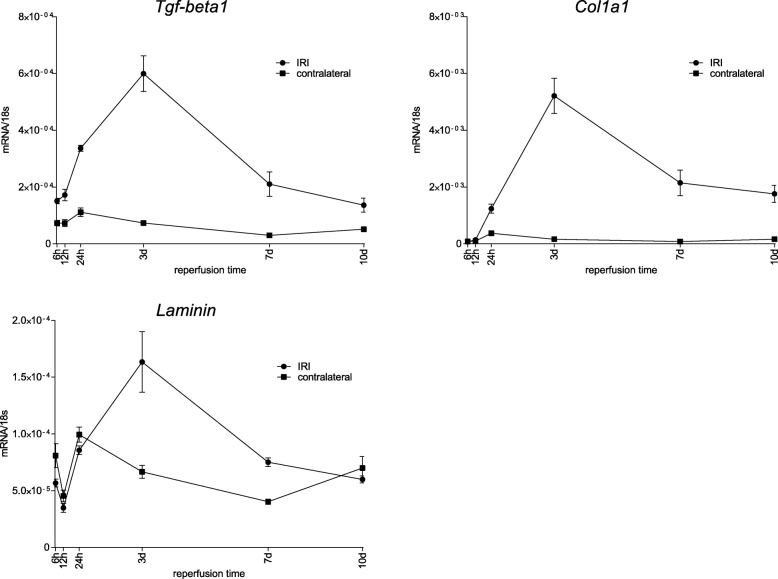
Fig. 10.
Course of fibrosis marker after ischemia for 35 min over reperfusion times between 6 h and 10 d. The expression of the markers Tgf-β1, Col1a1 and Laminin showed very similar patterns of expression. In the ischemic kidneys all markers upregulated their expression until 3 d, followed by a constant decline with remaining expression of Tgf-β1 and Col1a1 on an elevated level and decline to baseline expression of Laminin. The contralateral kidneys revealed upregulated expression of Tgf-β1 and Col1a1, whereas Laminin showed an initial drop of expression at 12 h with a rise at the end of observation period a 10 d. Displayed are means with s.e.m

