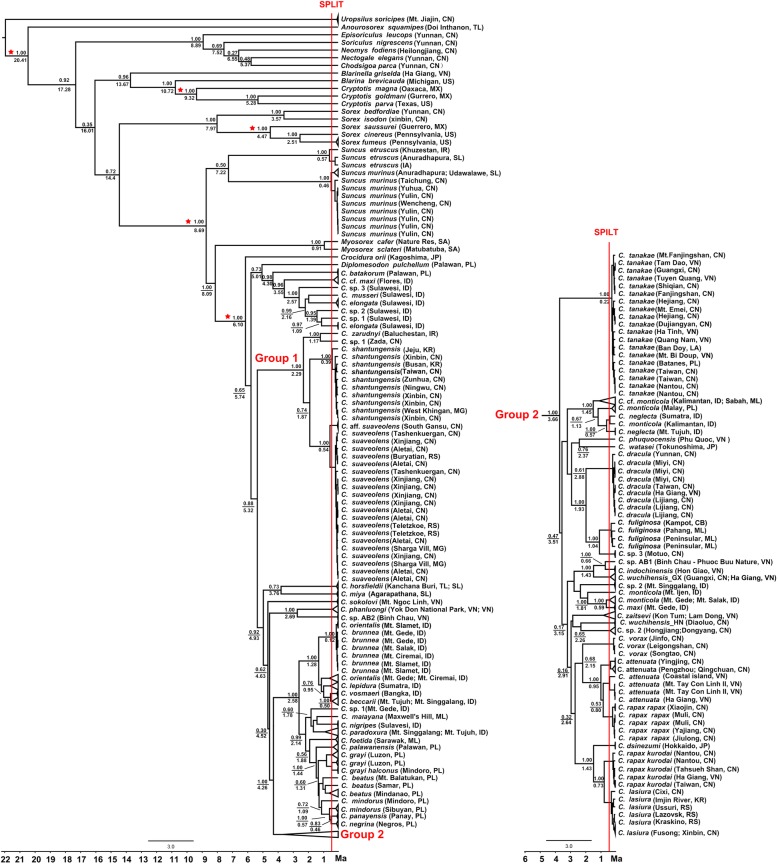
Fig. 3.
Chronogram from Bayesian analysis using a relaxed molecular clock and GMYC-based species delimitation based on dataset 4. The five red asterisks represent nodes whose age was calibrated with fossil taxa. Nodes of Bayesian posterior probabilities (above line) and estimated median times of divergence (below line) are shown. The red vertical lines indicate the maximum-likelihood transition point where the branching rates switch from interspecific to intraspecific events. Some triangles on tips are represented as the same species for simplification. Abbreviations of countries: America, US; Cambodia, CB; China, CN; India, IA; Indonesia, ID; Iran, IR; Japan, JP; Korea, KR; Laos, LA; Malaysia, ML; Mexico, MX; Mongolia, MG; Philippines, PL; Russia, RS; South Africa, SA; Sri Lanka, SL; Thailand, TL; Vietnam, VN

