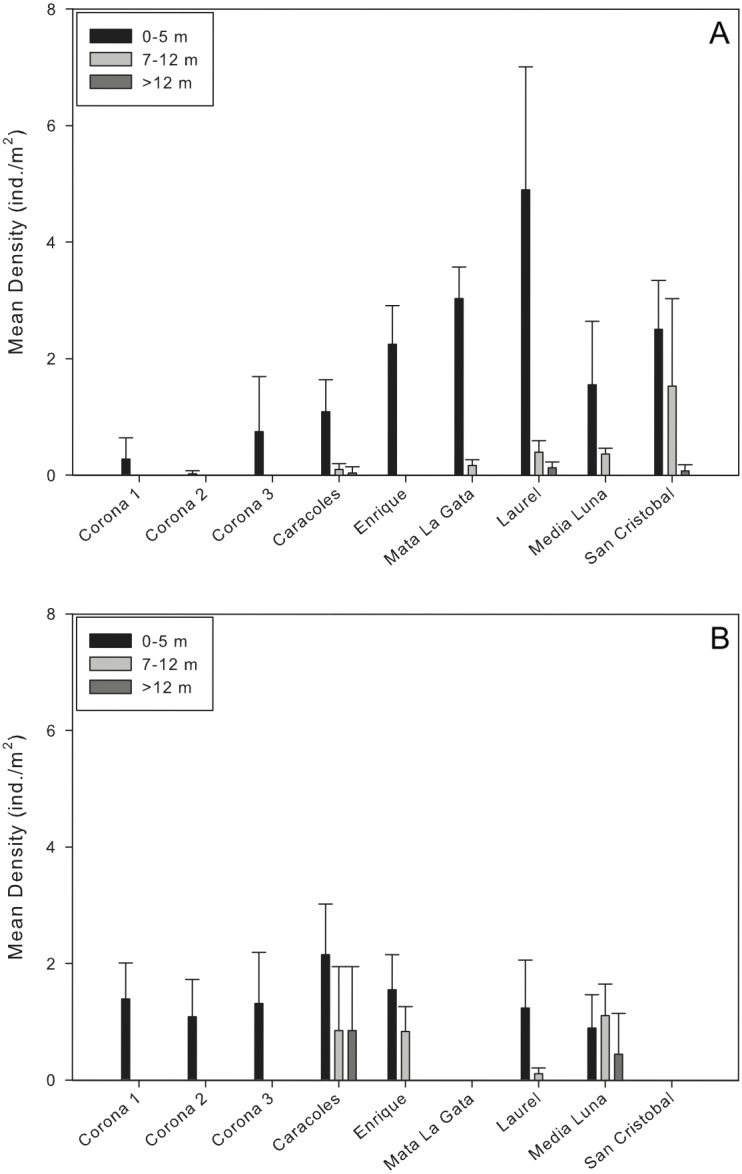
Figure 2. Comparison of Diadema antillarum densities between years and sampling localities.

Data are mean densities (±SD) of D. antillarum in (A) each of the reefs and seagrass mounds sampled in this study and (B) each of the reef and seagrass mounds sampled in 2001 (Weil, Torres & Ashton, 2005). Mata La Gata and San Cristobal were not sampled in the 2001 study. The number of transects completed at each depth interval in the 2001 study are as follows: Corona 1, n = 8; Corona 2, n = 7; Corona 3, n = 5; Caracoles, n = 12 (0–5 m), n = 6 (7–12 m), n = 6 (>12 m); Enrigue, n = 6 (0–5 m), n = 6 (7–12 m), n = 0 (>12 m); Laurel, n = 8 (0–5 m), n = 4 (7–12 m), n = 0 (>12 m); Media Luna, n = 12 (0–5 m), n = 6 (7–12 m), n = 6 (>12 m). All data are individuals per m2.
