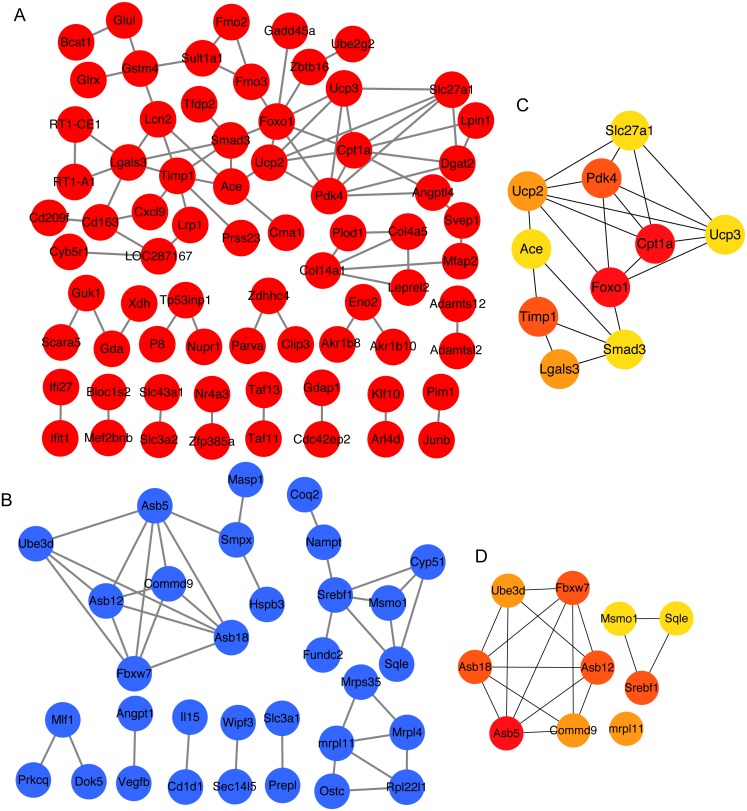
Figure 3. The top 10 mRNAs identified in protein–protein interaction networks.
(A) The protein–protein interaction network of overlapping upregulated DEGs at 3 and 4 weeks. The red represents significantly upregulated mRNAs in GK rats at the age of 3 and 4 weeks. (B) The protein–protein interaction network of overlapping downregulated DEGs at 3 and 4 weeks. The blue represents significantly downregulated mRNAs in GK rats at the age of 3 and 4 weeks. (C) The top 10 upregulated mRNAs ranked by node degree. The darker of the color indicates the higher of connectivity degree. (D) The top 10 downregulated mRNAs ranked by node degree. The darker of the color indicates the higher of connectivity degree.

